Cloud Storage Performance Overview
Users hate waiting for data from their Cloud application. As we move more applications to the Cloud, CPU, RAM, and fast networks are plentiful. However, storage rises to the top of the list for Cloud application bottlenecks. This blog gives recommendations to increase cloud storage performance for both managed storage services such as EFS and self-managed storage using a Cloud NAS. Trust Buurst’s SoftNAS for your cloud storage performance needs!
Here, you will find lots of performance statistics between AWS EFS and SoftNAS AWS NAS Storage.
Managed Service Cloud Storage
Many cloud architects turned to a managed cloud file service for cloud storage, such as AWS EFS, FSx, or Azure Files.
Amazon EFS uses the NFS protocol for Linux workloads.
FSx uses the CIFS protocol for Windows workloads.
Azure Files provides CIFS protocol for Windows.
None of these managed services provide iSCSI, FTP, or SFTP protocols.
Throttled Bandwidth Slows Performance
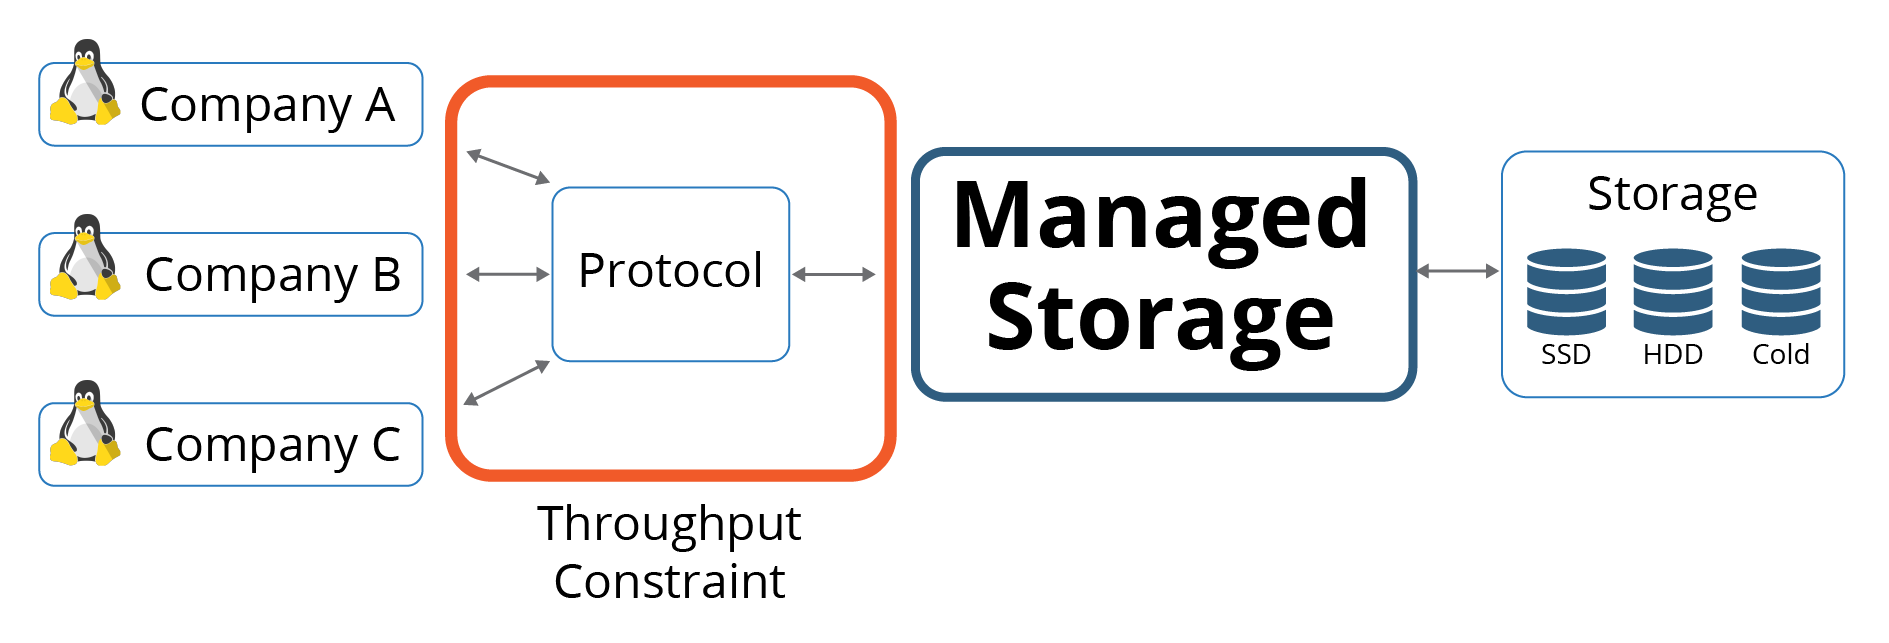
Hundreds, even thousands of customers access storage through the same managed storage gateway. To prevent one company from using all the Throughput, managed storage services deliberately throttle bandwidth making performance inconsistent.
Buying More Capacity – Storing Dummy Data
To increase performance from a managed service file system, users must purchase additional storage capacity that they may not need or even use. Many companies store dummy data on the file shares to get more performance, therefore paying for more storage and achieving the performance needed for their application. Or, users can pay an additional premium price for provisioned Throughput or provisioned IOPS.
What Are You Paying For – More Capacity or Actual Performance?
AWS EFS Performance
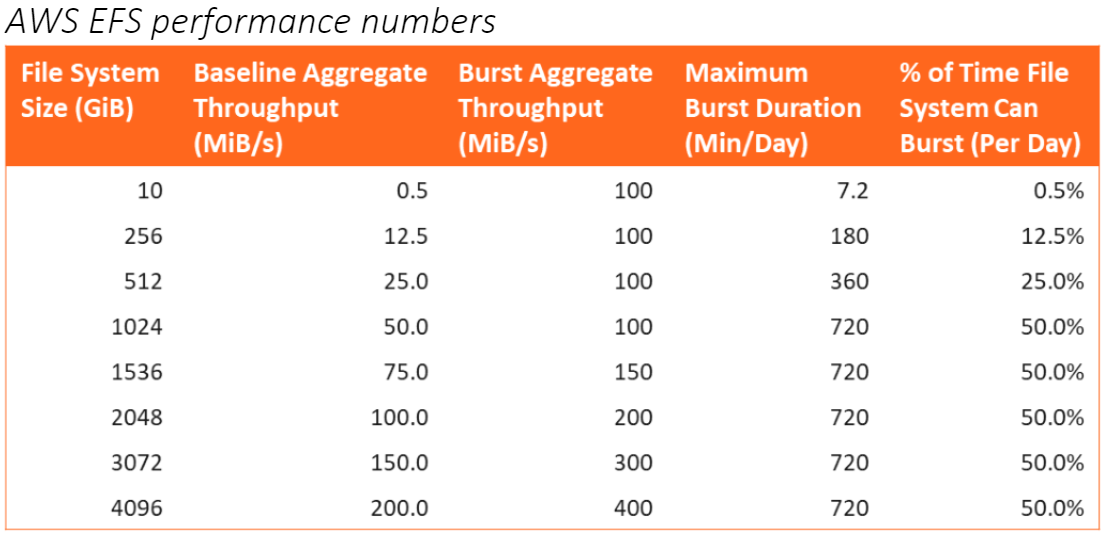
AWS provides a table that offers some guidance for the size of the File System and the Throughput users should expect. For solutions that require 100 MiB/s throughputs, that only have 1024 GiB storage, users will have to store and maintain 1024 GiB of useless data to achieve the published Throughput of 100 MiB/s. And because they were forced to overprovision, they are precluded from using Infrequent Access (IA) for the idle data that’s simply a “placeholder” to gain some AWS EFS performance.
With AWS EFS, users can pay extra for an increased throughput for $6.00 MB/s-Month, or $600 per 100 MB/s-Month.
Later in this paper, we will look at real-world performance benchmark data comparing AWS EFS to a cloud NAS.
Direct-Attached Block Storage – Highest-performance cloud storage
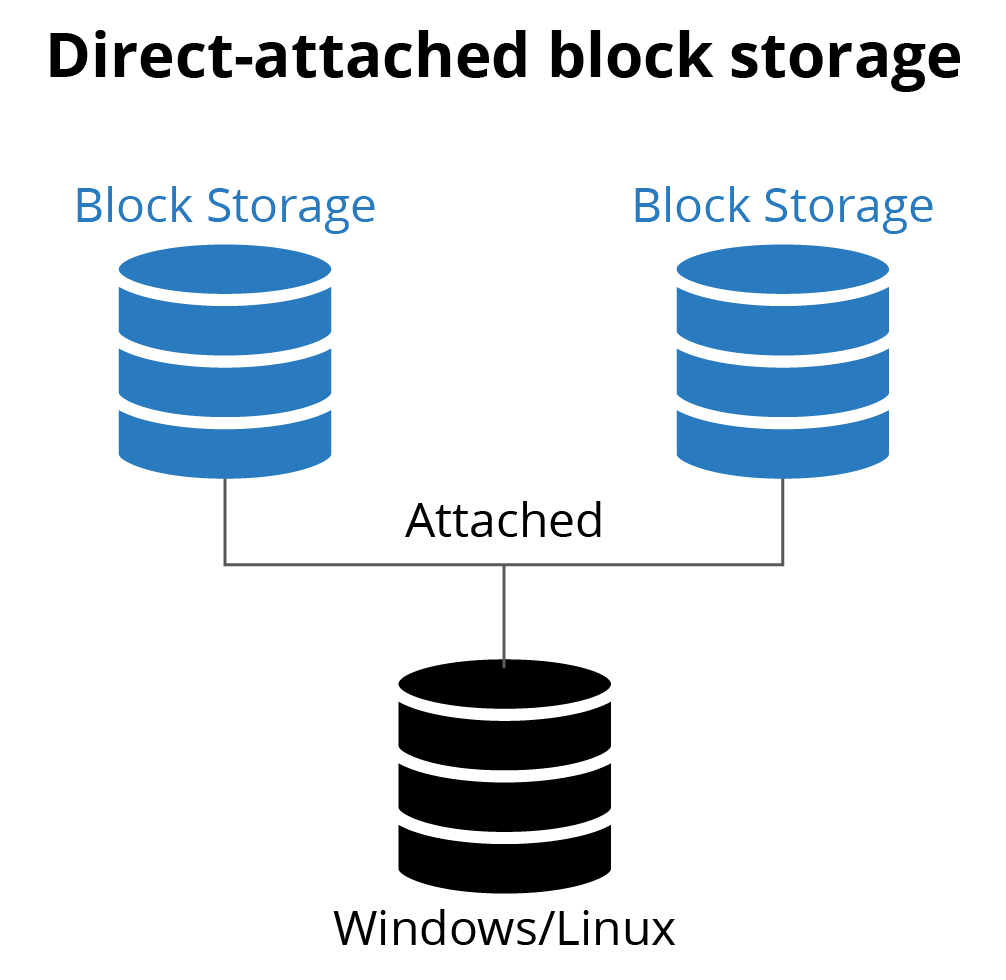
The high performance cloud storage model is to attach block storage to the virtual server directly. This model connects block storage to each VM, but it is unable to be shared across multiple VMs.
Let’s Take a Trip Back to the 90’s
Direct-attached storage is how we commonly configured storage for the data center servers back in the ’90s. When you needed more storage, you turned the server off, opened the case, added hard disks, closed the case, and re-started the server. This cumbersome model could not meet any SLAs of 5-9s availability, so data centers everywhere turned to NAS and SAN solutions for disk management.
Trying to implement direct-attached storage for cloud-scale environments presents many of the same challenges of physical servers along with backup and restore, replication across availability zones, etc.
How a Cloud NAS Storage Improves Performance?
A cloud NAS or NAS Filer has direct connectivity to cloud block storage and provides a private connection to clients owned by your organization.
Four main levers used to tune the performance of cloud-based storage:
- Increase the compute: CPU, RAM, and Network speed of the cloud NAS instance.
AWS and Azure virtual machines come with a wide variety of computing configurations. The more compute resources users allocate to their cloud NAS, the greater access they have to cache, Throughput, and IOPS. - Utilize L1 and L2 cache.
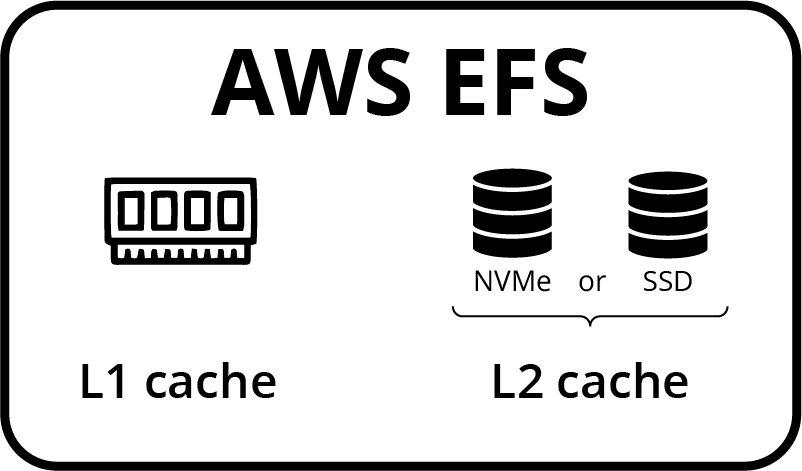
A cloud NAS would automatically use half of system RAM as an L1 cache. You can configure the NAS to use NMVE or SSD disk per storage pool for additional cache performance. - Use default client protocols.
The default protocol for Linux is NFS, Windows default protocol is CIFS, and both operating systems can access storage through iSCSI. Although Windows can connect to storage with NFS, it is best to use default protocols, as Windows NFS is notoriously slow. With workloads such as SQL, iSCSI would be the preferred protocol for database storage. - Have a dedicated channel from the client to the NAS.
A cloud NAS improves performance by having dedicated storage attached to the NAS and a dedicated connection to the client, coupled with dedicated cache and CPU to move data fast.
The caching of data is one of the most essential and proven technologies for improving cloud storage performance.
A cloud NAS has two types of cache to increase performance – L1 and L2 cache.
Level 1 (L1) Cache is an allocation of RAM dedicated to frequently accessed storage. Cloud NAS solutions can allocate 50% or more of system RAM for NAS cache. For a NAS instance that has 128 GB of RAM, the cloud NAS will use 64 GB for file caching.
Level 2 (L2) Cache is NVME or SSD for larger capacity cache configured at the storage pool level. NVMe can hold terabytes of commonly accessed storage, reducing access latency sub-millisecond in most cases.
Improve Cache for Managed Service
Managed services for storage may have a cache of frequently used files. However, the managed service is providing data for thousands of customers, so the chances of obtaining data from the cache are low. Instead, you can increase the cache side of each client. It is recommended by AWS to increase the size of the read and write buffers for your NFS client to 1MB when you mount your file system.
Improve Cache for Cloud NAS
Cloud NAS makes use of the L1 and L2 cache for your NAS VM. RAM for cloud virtual machines ranges from 0.5 MB to 120 GB. SoftNAS Cloud NAS uses half of the RAM for L1 cache.
For L2 cache, SoftNAS can dedicate NVMe or SSD to an individual or tiering volume. For some applications, an SSD L2 cache may provide an acceptable level of performance, for the highest level of performance, a combination of L1 (Ram) AND L2 cache will deliver the best performance price.
Cloud storage performance is governed by a combination of Protocols, Throughput and IOPs.
Choosing Native Client Protocols Will Increase Cloud Storage Performance.
Your datacenter NAS supports multiple client protocols to connect storage to clients such as Linux and Windows. As you migrate more workloads to the cloud, choosing a client protocol between your client and storage that is native to the storage server operating system (Linux or Windows) will increase the overall performance of your solution.
Linux native protocols include iSCSI, Network File System (NFS), FTP, and SFTP.
Windows native protocols are iSCSI and Common Internet File System (CIFS), which is a dialect of Server Message Block (SMB). Although Windows with POSIX can run NFS, it’s not native to Windows, and in many cases, you will have better performance running native protocol CIFS/SMB instead of NFS on Windows.
The following chart shows how these protocols compare across AWS and Azure today.
| SoftNAS | AWS EFS | AWS FSx | Azure files | |
| NFS | supported | supported | ||
| CIFS | supported | supported | supported | |
| FTP | supported | |||
| SFTP | supported |
For block-level data transport, iSCSI will deliver the best overall performance.
iSCSI is one of the more popular communications protocols in use today and is native in both Windows and Linux. For Windows, iSCSI also provides the advantage of looking like a local disk drive for applications that require the use of local drive letters, e.g., SQL Server snapshots and HA clustered shared volumes.
Throughput
Throughput is the measurement of how fast (per second) your storage can read/write data, typically measured in MB/sec or GB/sec. You may have seen this number before when looking at cloud-based hard drive (HDD) or solid-state disk (SSD) specifications.
Improve Throughput for Managed Service
For managed cloud file services, Throughput is the amount of storage you purchase. Throughput varies from 0.5 to 400 MBs. To prevent one customer from overuse the access to a pool of disks, Azure and AWS throttles access to storage. They both also allow for short bursting to the disk set and will charge for over bursting.
Improve Throughput for Cloud NAS
For a cloud NAS, Throughput is determined by the size of the NAS virtual machine, the network, and disk speeds. AWS and Azure allocate more Throughput on VM images that have access to more RAM and CPU. Since the NAS is dedicated to the owner of the NAS, the storage is directly attached to the NAS; there is no need to throttle or burst limit throughput to the clients. That is, Cloud NAS provides continuous, sustained Throughput all the time for predictable performance.
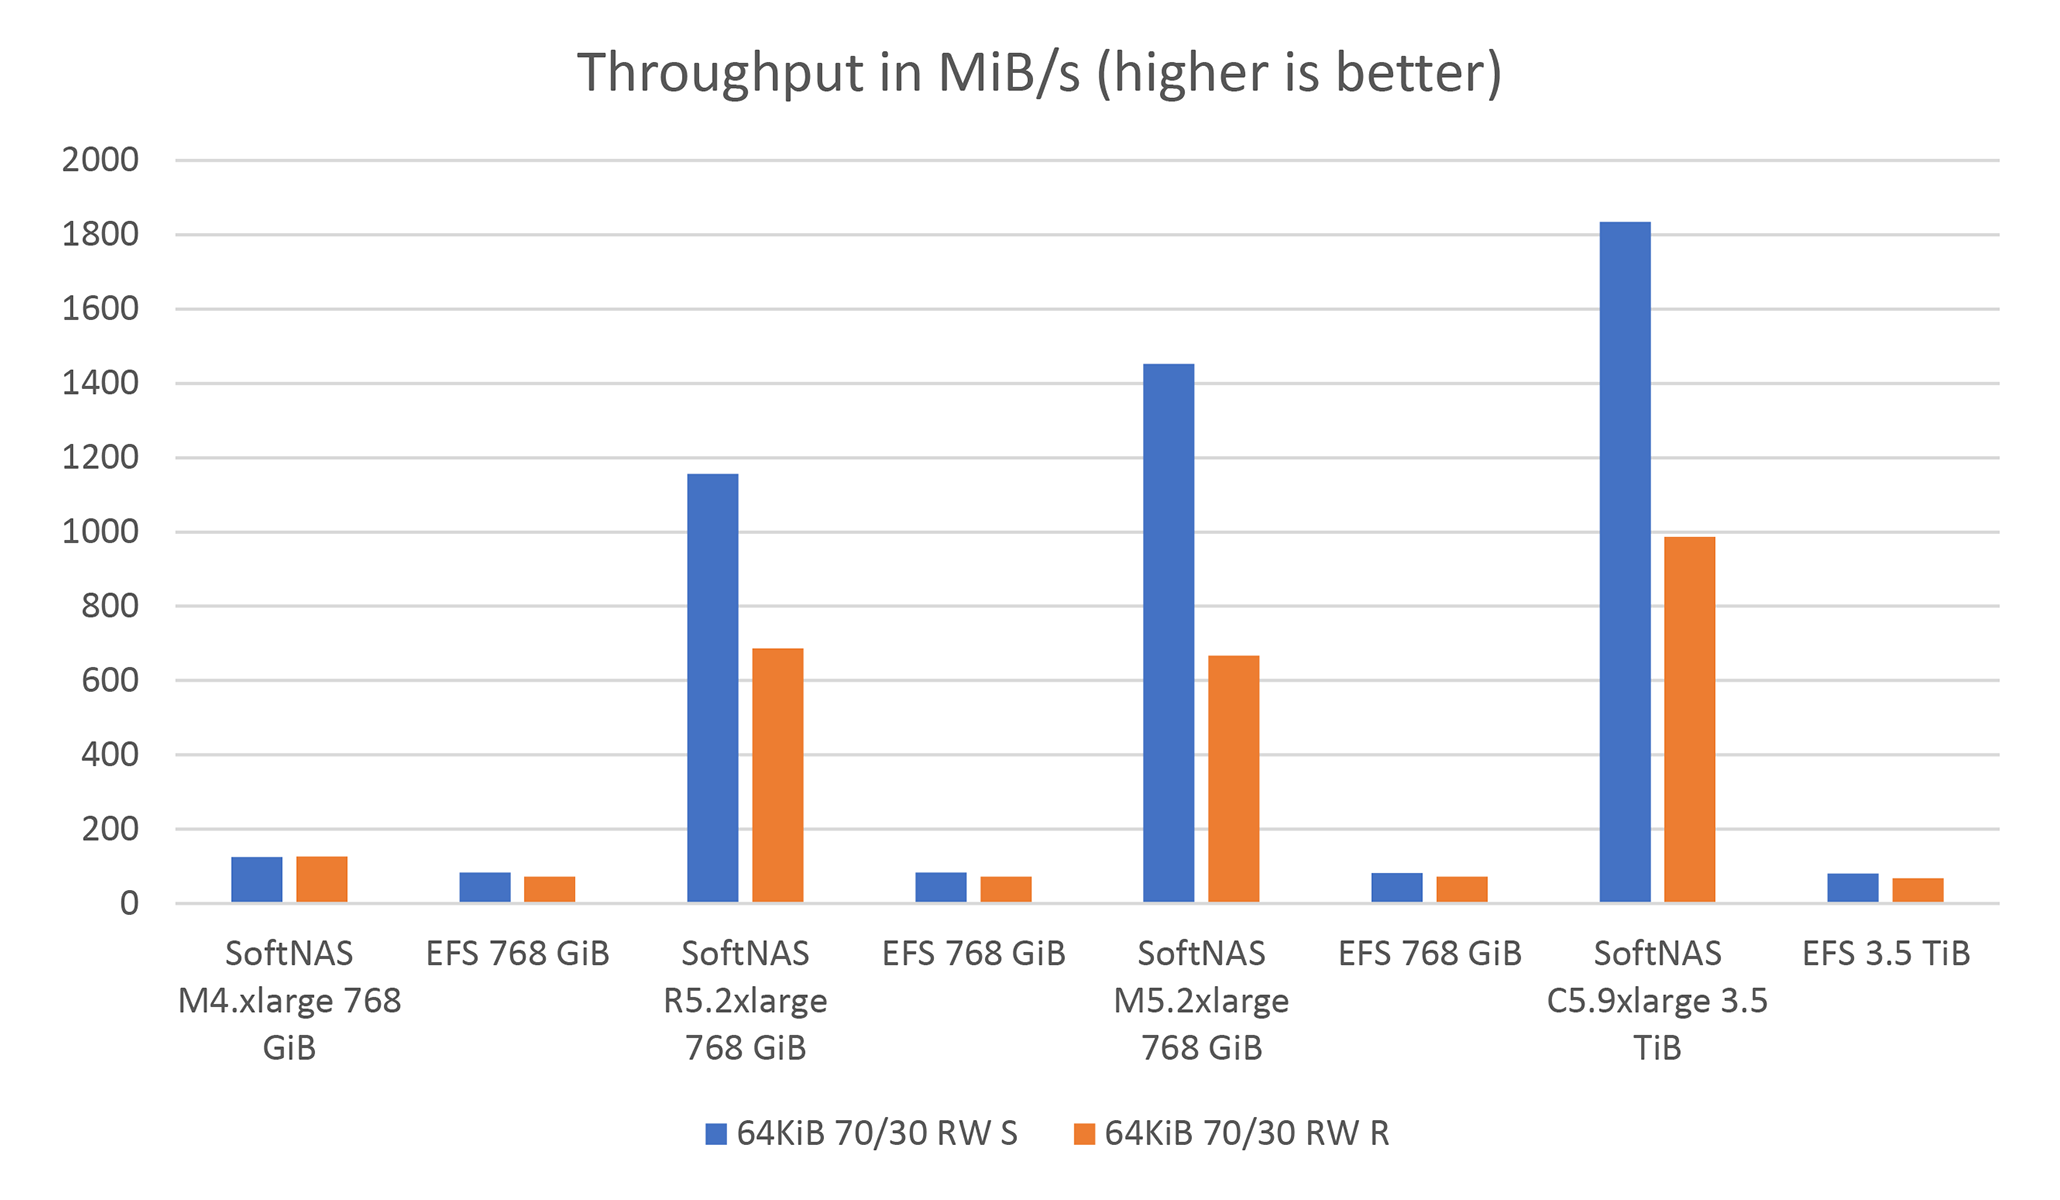
Comparing Throughput MiB/s
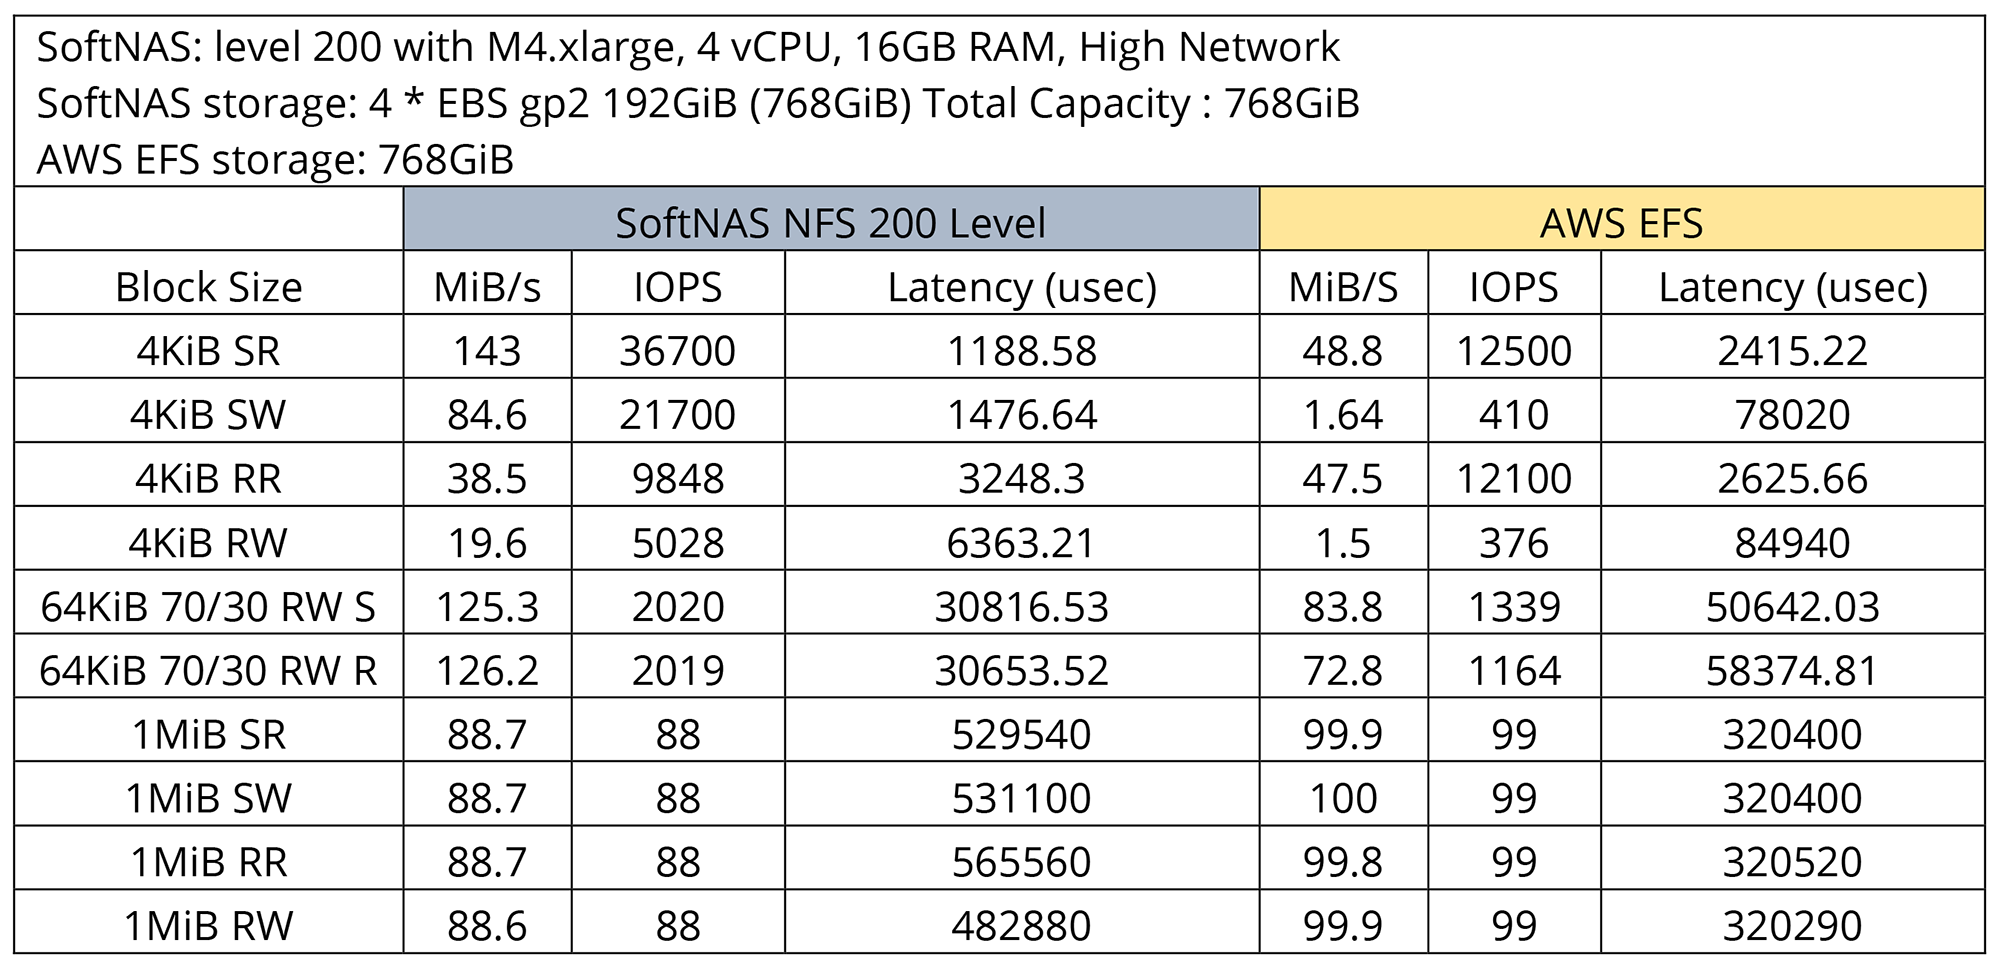
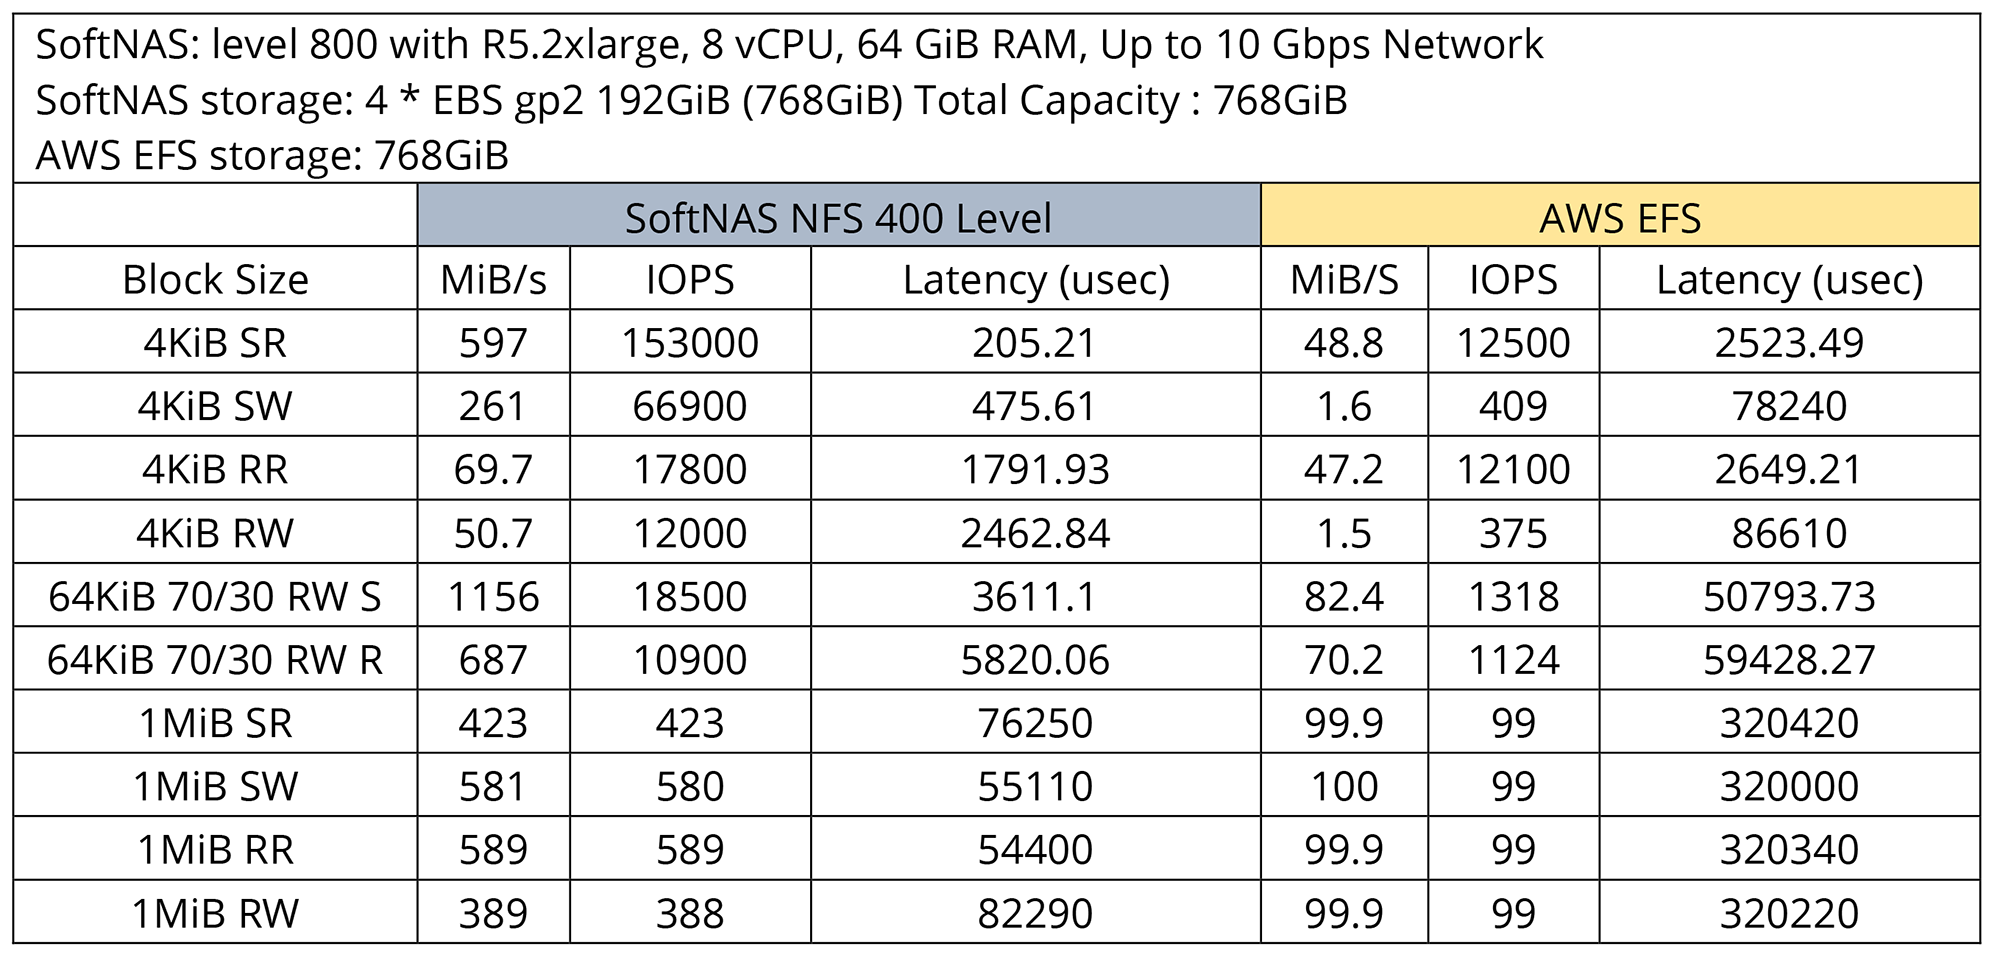
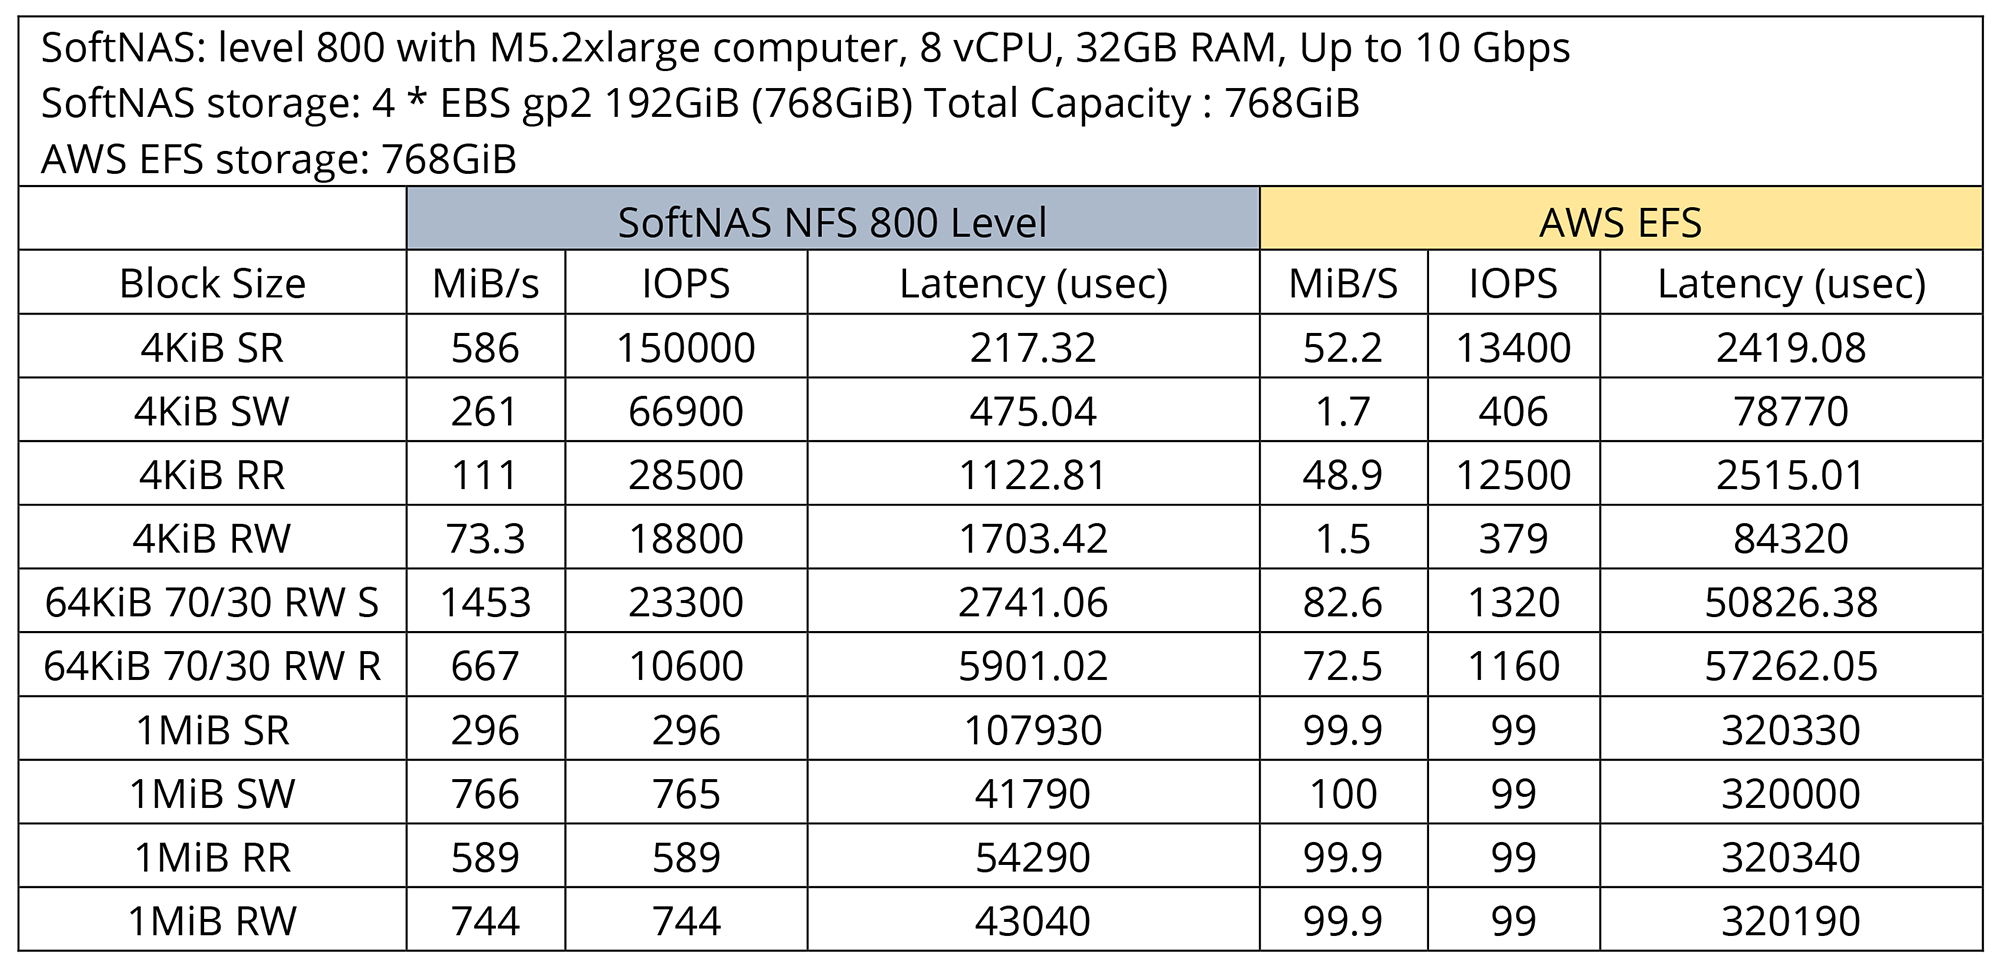
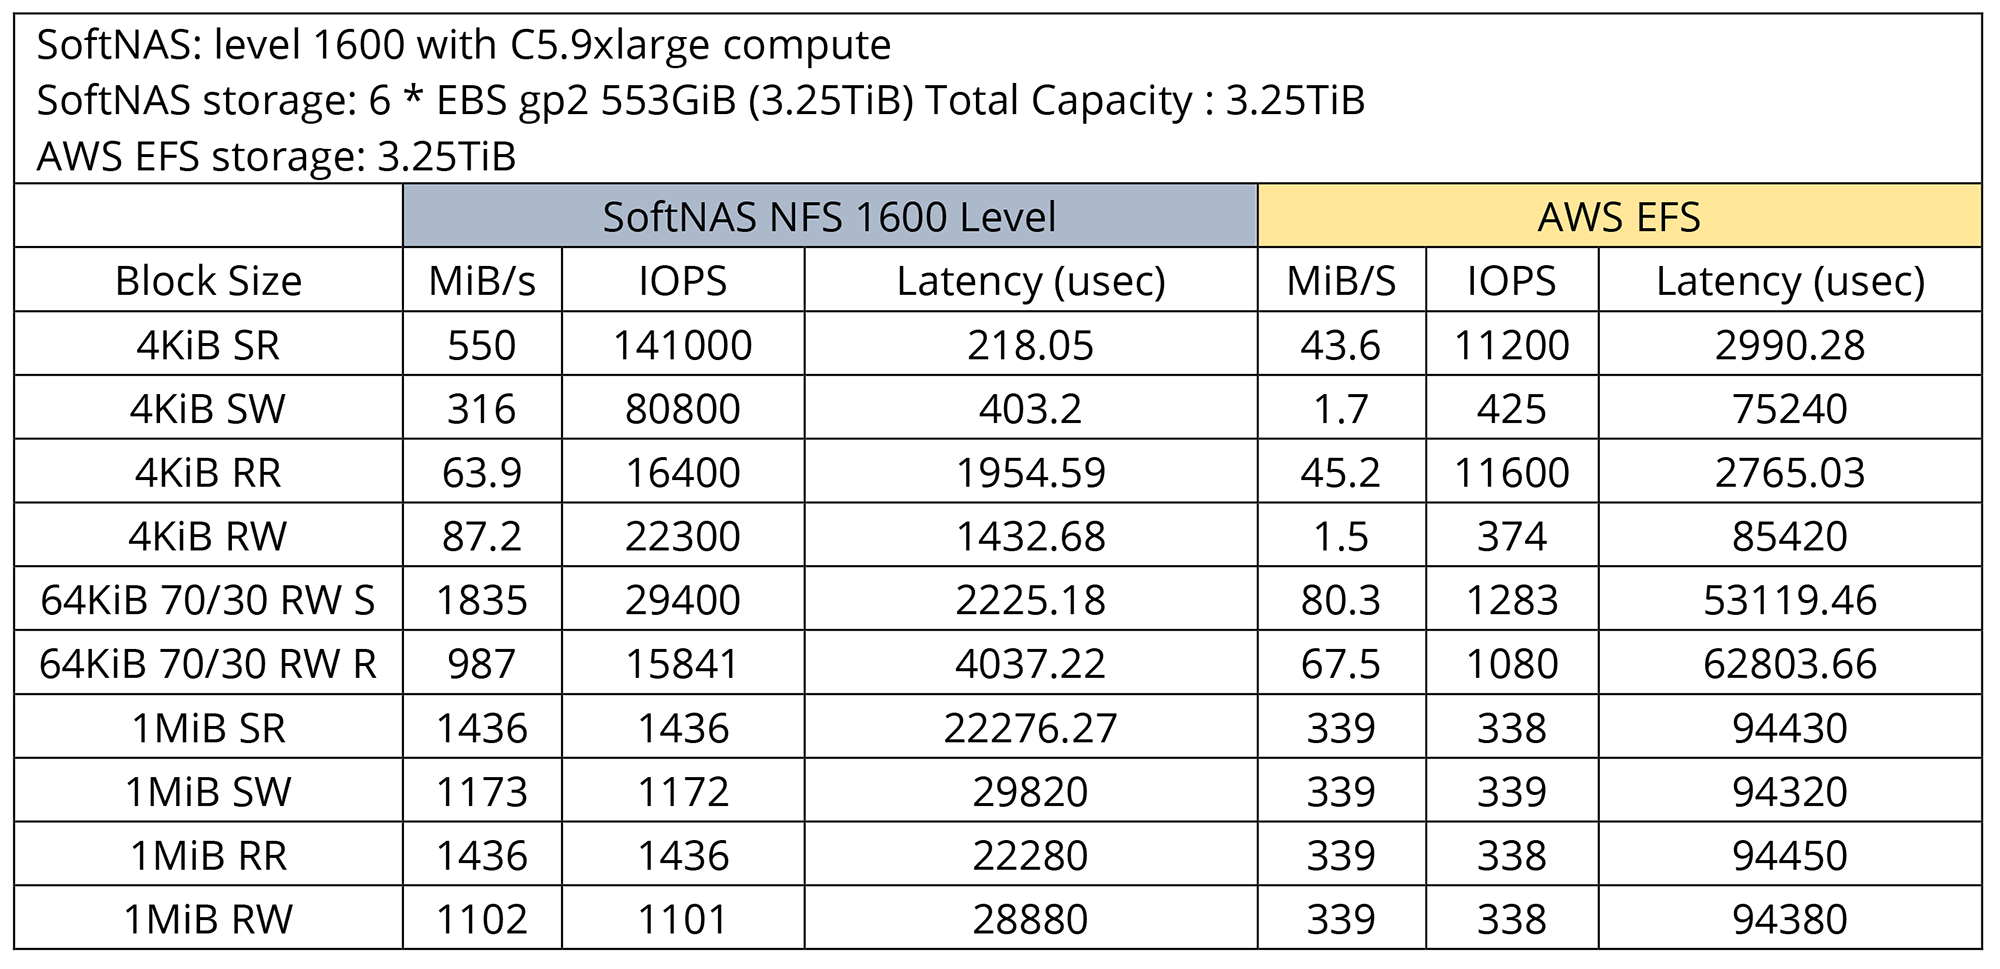
A Linux FIO server was used to perform a throughput evaluation of SoftNAS vs EFS. With a cloud storage capacity of 768 GiB, 3.5 TiB, and a test configuration of 64KiB, 70% read and 30% write, the SoftNAS was able to out perform AWS EFS MiB/s in both sequential and random read/writes.
IOPs
IOPs are Input/output operations per second and is used as a performance measurement to characterize storage performance. Disks such as NVMe, SSD, HDD, and cold storage vary in IOPS. The higher the IOPS, the faster you have access to the data stored on the disk.
Improve IOPS for Managed Cloud File Storage
There is no configuration to increase the IOPS of a managed cloud file store.
Improve IOPS for Cloud NAS
To improve IOPS on a cloud NAS, you increase the amount of CPU’s which increase the available RAM and network speed and you can add more disk I/O devices as an array to aggregate each disk’s IOPS to as high as 1 million IOPS with NVMe over 100 Gbps networking, for example.
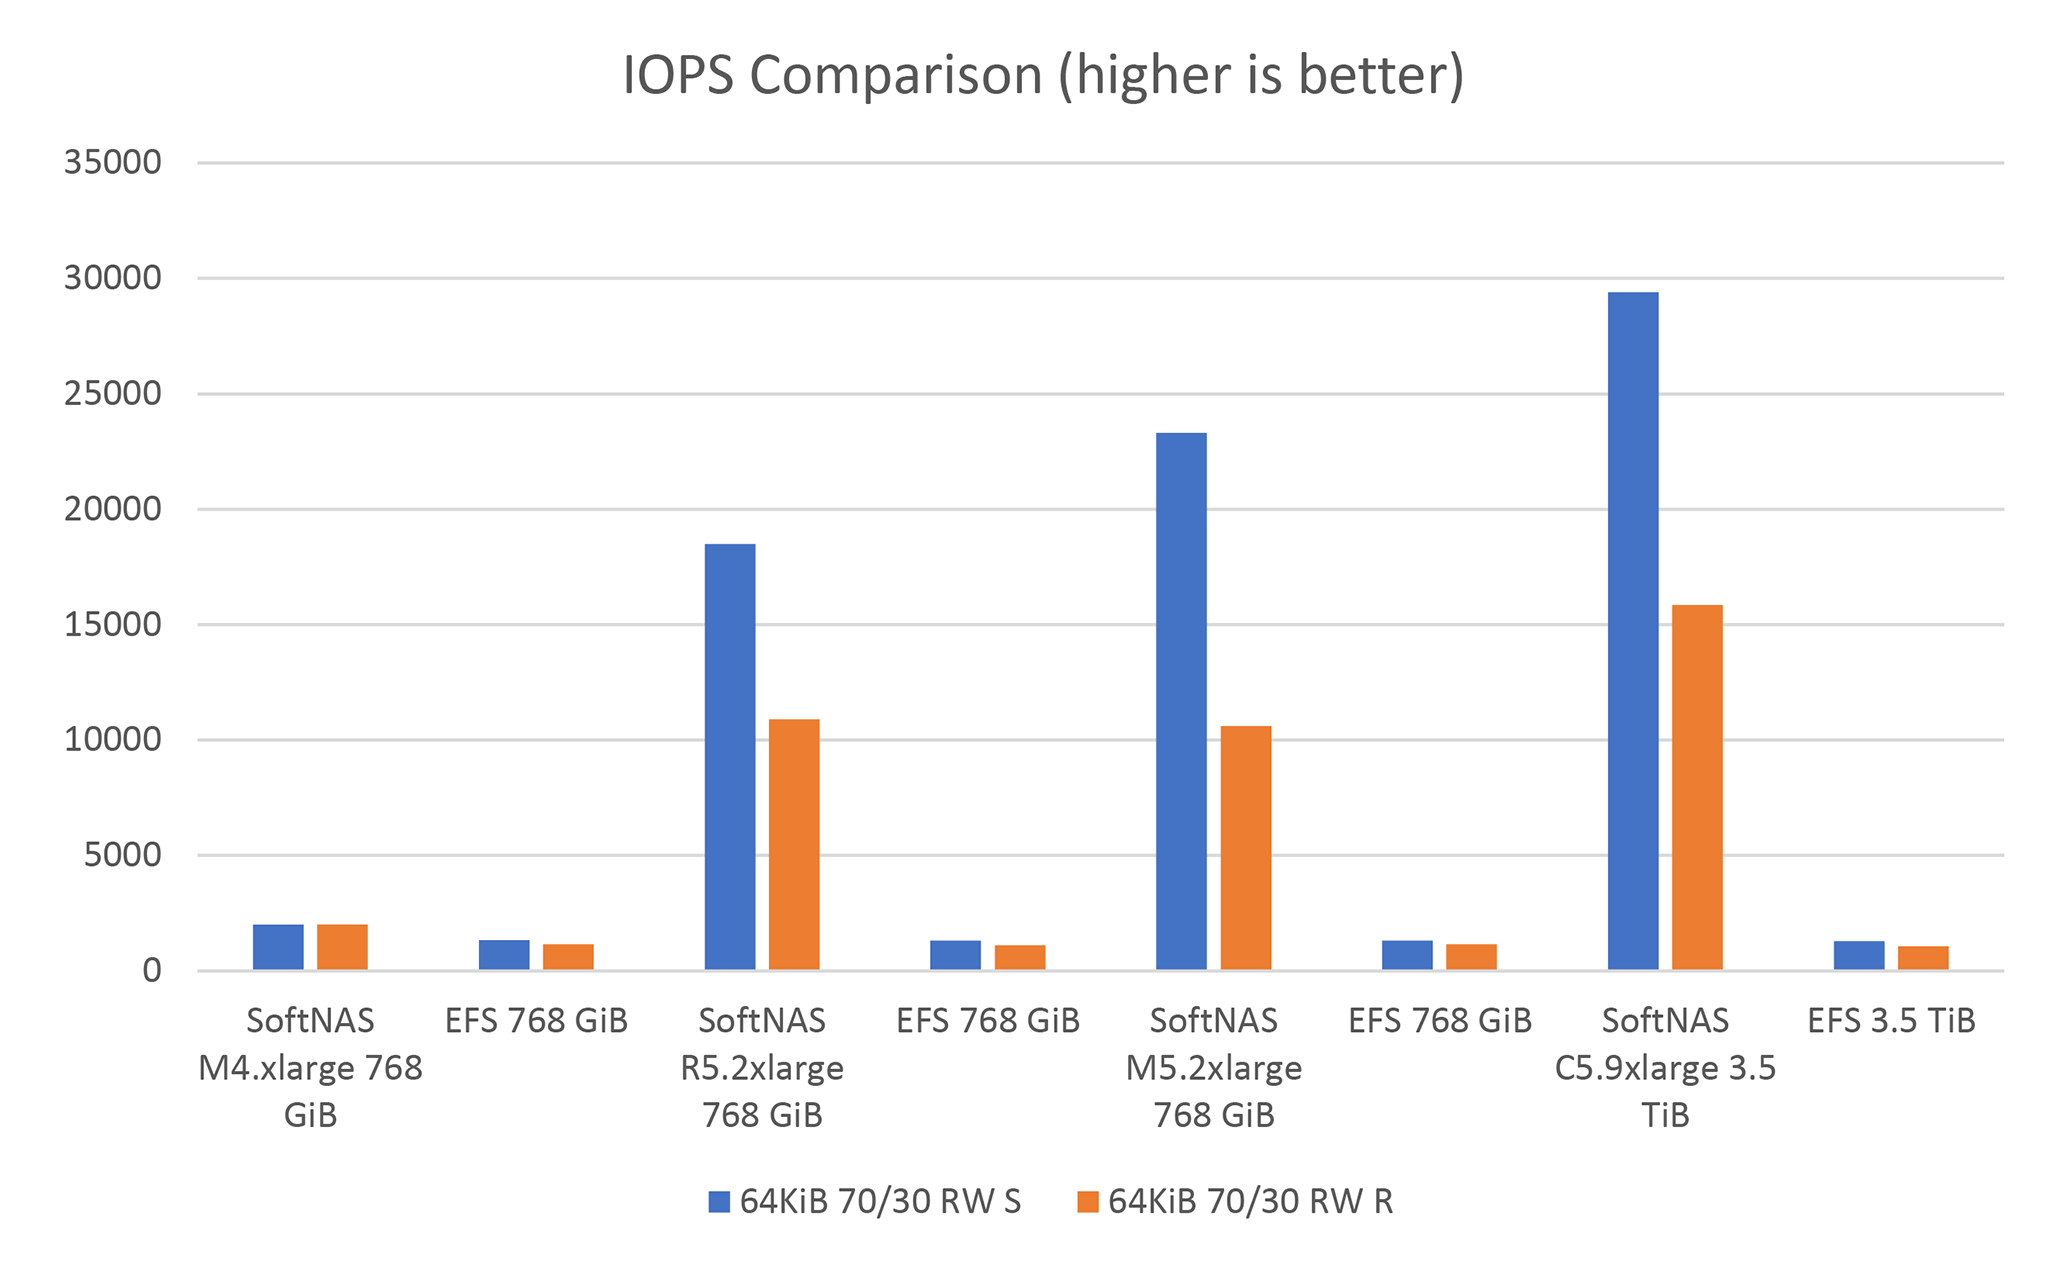
Comparing Throughput IOPS
A Linux FIO server was used to perform an IOPS evaluation of SoftNAS vs EFS. With a cloud storage capacity of 768 GiB, 3.5 TiB, and a test configuration of 64KiB, 70% read and 30% write, the SoftNAS was able to out perform AWS EFS IOPS in both sequential and random read/writes.
How Buurst Shattered the 1 Million IOPs Barrier
NVMe (non-volatile memory express) technology is now available as a service in the AWS cloud with certain EC2 instance types. Coupled with 100 Gbps networking, NVME SSDs open new frontiers of HPC and transactional workloads to run in the cloud. And because it’s available “as a service,” powerful HPC storage and compute clusters can be spun up on-demand, without the capital investments, time delays, and long-term commitments usually associated with High-Performance Computing (HPC) on-premises.
This solution leverages the Elastic Fabric Adapter (EFA), and AWS clustered placement groups with i3en family instances and 100 Gbps networking. SoftNAS Labs testing measured up to 15 GB/second random read and 12.2 GB/second random write throughput. We also observed more than 1 million read IOPS and 876,000 write IOPS from a Linux client, all running FIO benchmarks.
Latency
Latency is a measure of the time required for a sub-system or a component in that sub-system to process a single storage transaction or data request. For storage sub-systems, latency refers to how long it takes for a single data request to be received and the right data found and accessed from the storage media. In a disk drive, read latency is the time required for the controller to find the proper data blocks and place the heads over those blocks (including the time needed to spin the disk platters) to begin the transfer process.
In a flash device, read latency includes the time to navigate through the various network connectivity (fibre, iSCSI, SCSI, PCIe Bus and now Memory Bus). Once that navigation is done, latency also includes the time within the flash sub-system to find the required data blocks and prepare to transfer data. For write operations on a flash device in a “steady-state” condition, latency can also include the time consumed by the flash controller to do overhead activities such as block erase, copy and ‘garbage collection’ in preparation for accepting new data. This is why flash write latency is typically greater than read latency.
Improve latency for Managed Cloud File Storage
There is no configuration to decrease the IOPS of a managed cloud file store
Improve Latency for Cloud NAS
Latency improves as the network, cache and CPU increases for the Cloud NAS
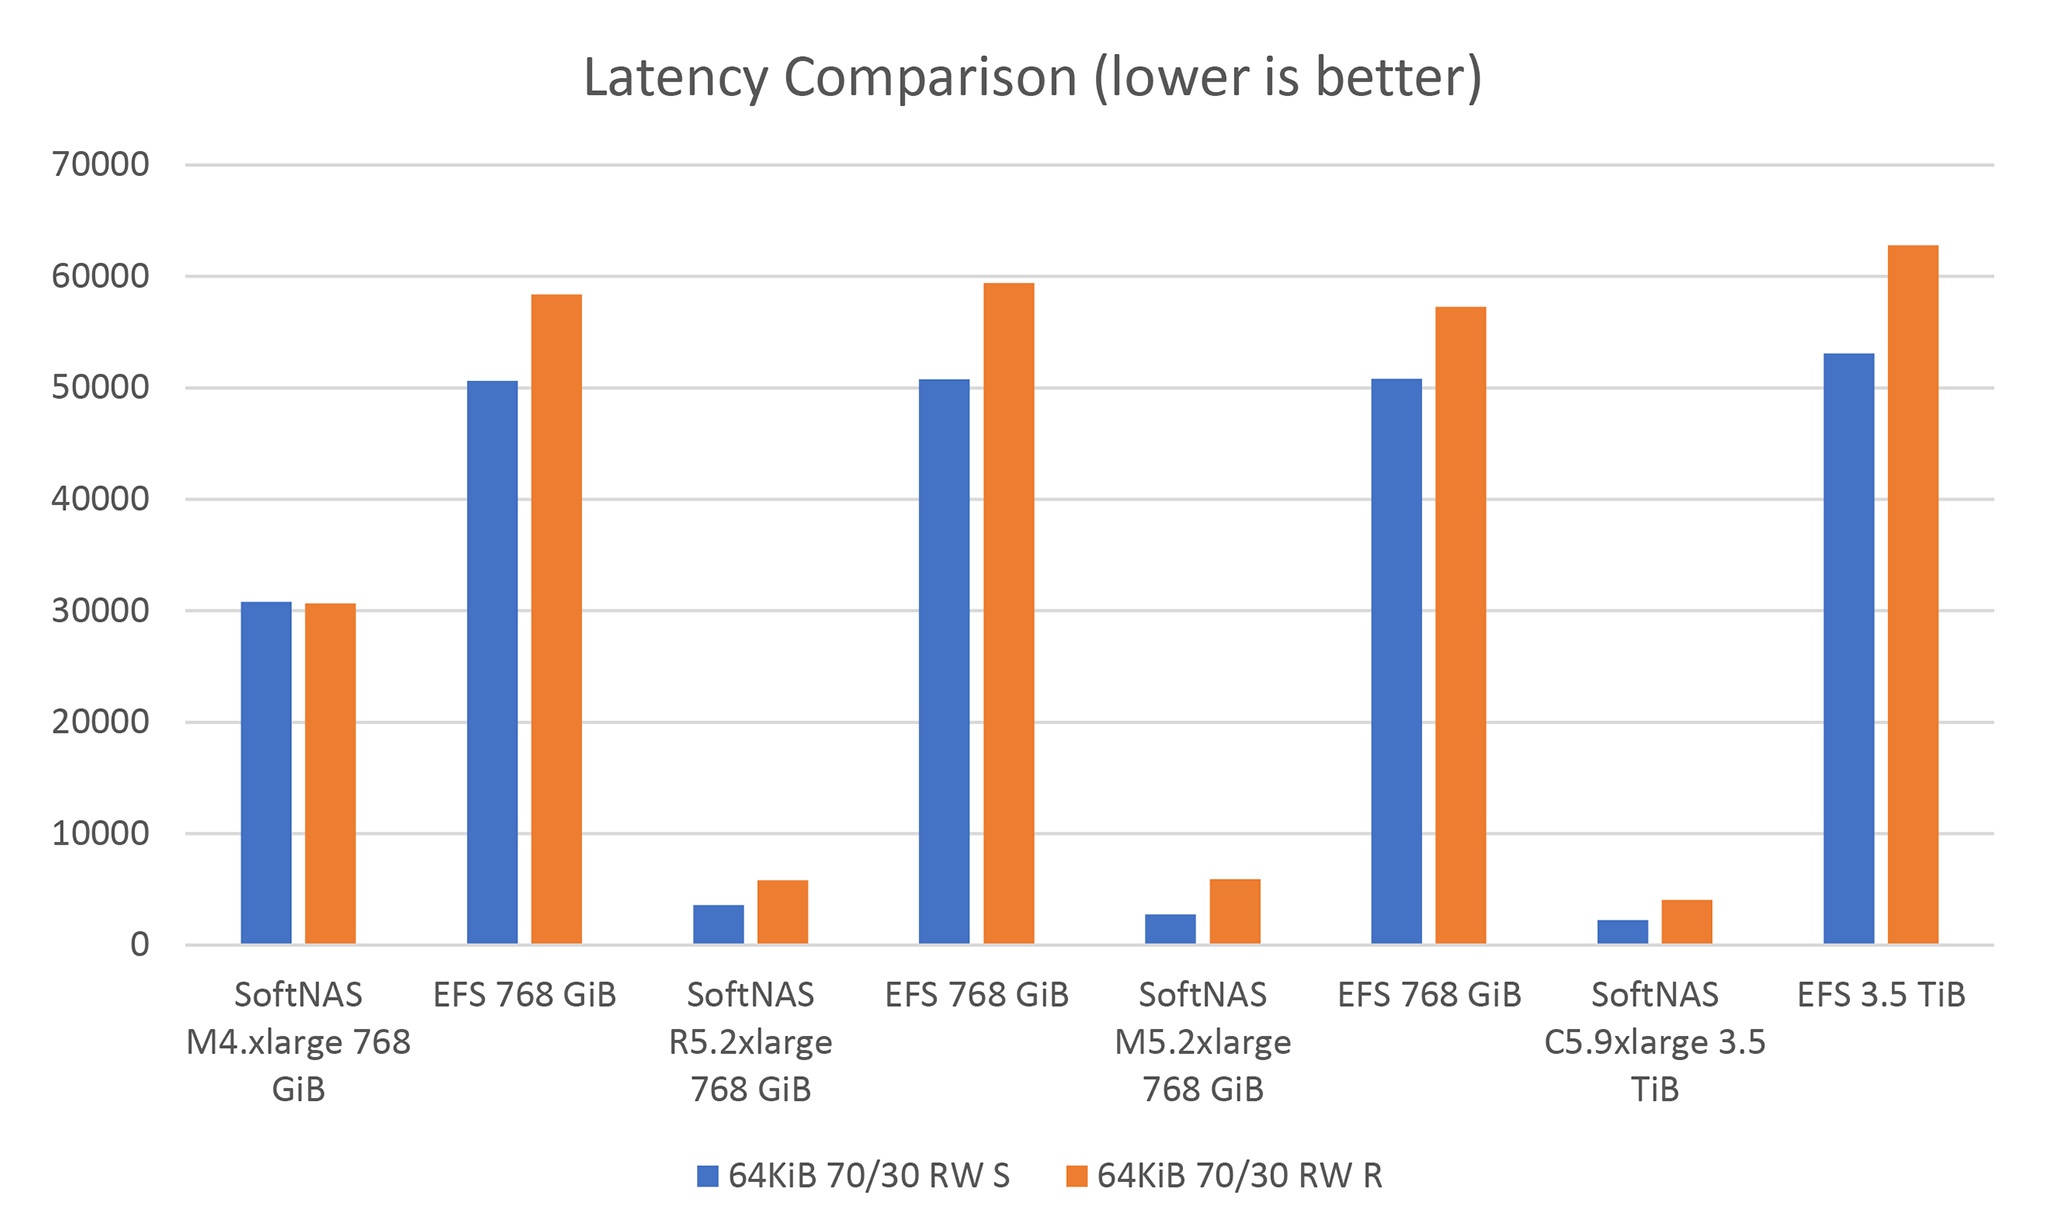
Comparing Latency
A Linux FIO server was used to perform a latency evaluation of SoftNAS vs EFS. With a cloud storage capacity of 768 GiB, 3.5 TiB, and a test configuration of 64KiB, 70% read and 30% write, the SoftNAS was able to out perform AWS EFS latency in both sequential and random read/writes.
Testing SoftNAS Cloud NAS to AWS EFS Performance
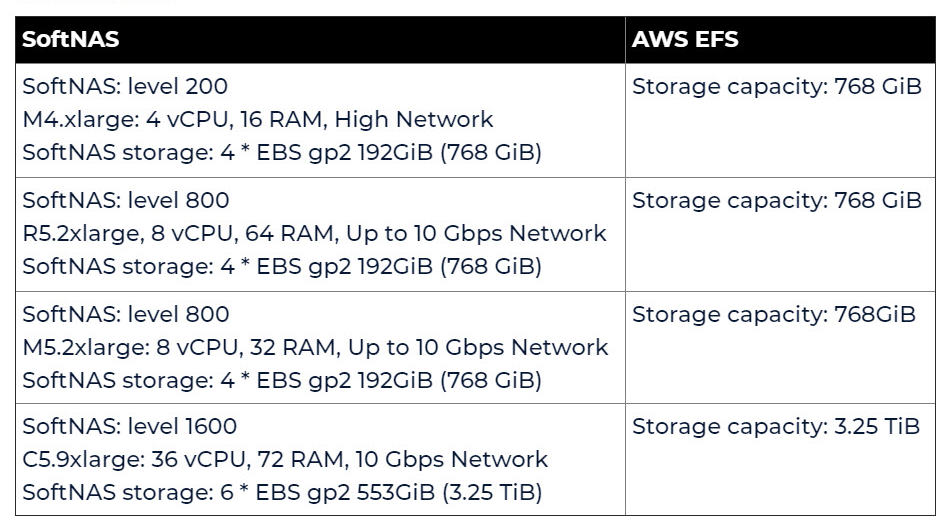
For our testing scenario we used a Linux FIO server with 4 Linux clinets running RHEL 8.1 running FIO Client. NFS was used to connect the clients to EFS and SoftNAS. The SoftNAS version was Version 4.4.3. AWS increases performance as storage increases, in order to create an apples to apples compairison, we used AWS published performance numbers as a baseline for the instance of the NAS. For instance, the SoftNAS level 200 – 800 tests used 768 GiB of storage where the SoftNAS 1600 test used 3.25 TiB.
Head to Head
Environment Description
Testing Methodology – SoftNAS Configuration.
The backend storage geometry is configured in such a way that the instance size, not the storage, is the bottleneck while driving 64KiB.
For example: M5.2xlarge (400 level) has a limit storage throughout limit of 566MiB/s. At 64KiB I/O we need to drive 9,056 IOPS to achieve this throughput at 64KiB request sizes.
AWS EBS disks provide 16,000 IOPS and 250 MiB/s throughput.
In this case a pool was created with 4 192GiB EBS volumes for a theoretical throughput of 1,000MiB/s and IOPs of 64,000: No bottleneck.
AWS EFS Configuration
AWS EFS performance scales based on used capacity. In order to provide the closest comparison, the EFS volume was pre-populated with data to consume the same amount of storage as the SoftNAS configuration.
SoftNAS capacity: 768 GiB (4 X 192 GiB)
AWS EFS : 768 GB of data added prior to running the test.
SoftNAS storage geometry was configured to provide sufficient IOPs at 64KiB I/O request sizes in order to exceed the throughput limit of the backend storage.
For example, to achieve the maximum allowed storage throughput for a VM limited to 96 MiB/s at 64KiB IO sizes we must be able to drive 1,536 IOPs.
Test Parameters
Ramp up time : 15 minutes
- This allows time for client side and server-side caches to fill up avoiding inflated results while initial cache is used/ filled
Run time 15minutes
- The length of time performance measurements are recorded during the test
Test file size: 2 X system memory
- Ensures that the server-side IO is not running in memory; writes and reads are to the backend storage
Idle : 15 minutes
- An idle time is inserted between each run ensuring the previous test has completed it’s I/O operations and will not contaminate other results.


