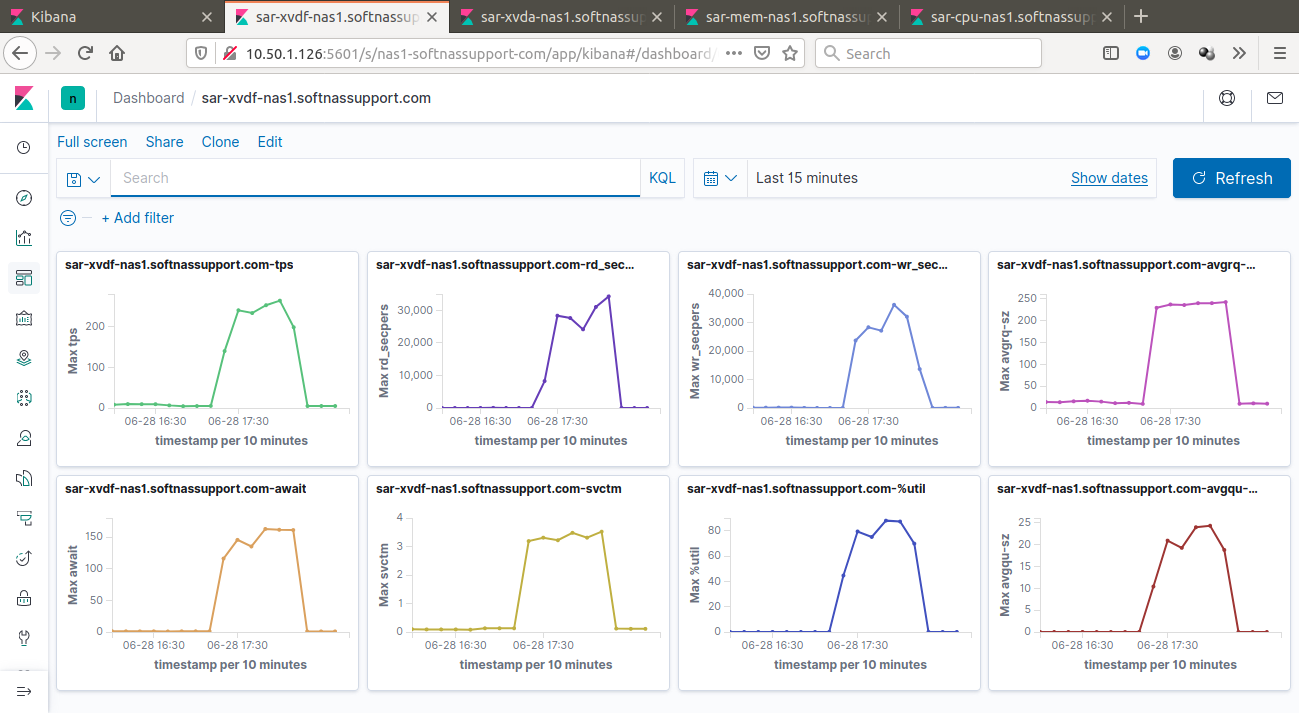
Sar, Elasticsearch, and Kibana… Kibana is a great visualization tool and this article shows how to automate building graphs and dashboards using API with Sar logs as a data source.
Sar is an old, but good, sysadmin tool that helps answer many performance-related questions…
- Did we have a CPU spike yesterday at 2 pm when the customer complained?
- Do we have enough RAM?
- Do we have enough IOPS with our brand new SSD disks?
Sar was a nice little tool that helped us collect statistics even without CloudWatch or SNMP or any other monitoring tool configured.
Well, Sar has its issues. By default, it collects statistics only once in 10 minutes and you will be deciphering the output like this:
01:00:01        CPU     %user     %nice   %system   %iowait    %steal     %idle
04:30:01        all      0.25      0.00      0.23     99.52      0.00      0.00
04:40:01        all      0.25      0.00      0.21     99.54      0.00      0.00
04:50:01        all      0.26      0.00      0.22     99.52      0.00      0.00
05:00:01        all      0.24      0.02      0.23     99.51      0.00      0.00
05:10:01        all      0.26      0.00      0.23     99.51      0.00      0.00
05:20:01        all      0.24      0.00      0.20     99.56      0.00      0.00
05:30:01        all      0.26      0.00      0.22     99.52      0.00      0.00
05:40:01        all      0.25      0.00      0.22     99.53      0.00      0.00
05:50:01        all      0.57      0.00      1.01     48.45      0.00     49.97
06:00:01        all      0.32      0.00      0.41     10.32      0.00     88.95
06:10:01        all      0.24      0.00      0.19      0.33      0.00     99.25
06:20:01        all      0.23      0.00      0.18      0.35      0.00     99.24
06:30:01        all      0.24      0.00      0.17      0.32      0.00     99.27
06:40:01        all      0.24      0.00      0.19      0.36      0.00     99.21
06:50:01        all      0.46      0.00      1.00     25.55      0.00     72.99
07:00:01        all      1.26      0.00      3.52     90.35      0.00      4.87
07:10:01        all      1.26      0.00      4.01     90.57      0.00      4.16
07:20:01        all      1.07      0.00      3.56     89.42      0.00      5.95
This is actually a good example that shows some event possibly requiring further investigation. The server was clearly stuck on IO subsystem as the %iowait column shows it was more than 99%. At 05:50 it suddenly became better, iowait dropped to nearly zero and overall CPU usage was less than 0.5%. Surely something was going on!
Sar, Elasticsearch, and Kibana
Elasticsearch is a much more sophisticated technology. Elasticsearch is a distributed search and analytics engine, but when we really speak of Elasticsearch, we are speaking of a bunch of interconnected products commonly known as Elastic Stack:
Beans – many small agents upload data to Elasticsearch.
Logstash – accepts data from the Beans, and after potentially complicated processing, uploads the transformed data into Elasticsearch.
Elasticsearch – the search and analytics engine and the heart of the Elastic Stack.
Kibana – a great visualization tool and a graphical interface to Elasticsearch.
Elasticsearch, Logstash, and Kibana
So, these capital letters comprise what used to be called an ELK stack – E from Elasticsearch, L from Logstash, and K from Kibana. These days we tend to include Beans into the Stack and call it Elastic Stack.
Performing virtual appliances health checks, our team often needs to analyze log sets from different customers on a regular basis. The logs contain tons of valuable information so why not feed it to Elasticsearch and see what happens?
Naturally, log files that we check most often have been sent to ElasticSearch using one of the beats – like the Filebeat – so we could visually explore the logs in Kibana pretty much instantaneously. Keeping the logs centrally is a good practice and ways to do it are really countless. Rsyslog, Splunk, Loggly, and CloudWatch Logs are popular central log solutions and Elasticsearch fits really well in this family.
Sar logs are a usual part of the log sets to be analyzed but there is sometimes a tiny inconvenience with Sar logs. They are often generated by older Sar versions, and there are 2 problems with that:
1. The current Sar does not understand the old version logs, and the old Sar version needs to be installed just to process the Sar logs.
2. The graphs can’t be easily produced due to the limitations of the old versions.
The backward compatibility of sars logs is out of our hands, and some practice and automation do not make the old Sar version installation too much of a problem. At the same time, analyzing Sar logs for many days and checking many parameters demands some graphical data presentation. For example, a current Sar on Ubuntu allows these commands to run:
sadf -g > cpu.svg
sadf -g -- -r > ram.svg
See these graphs in your favorite browser or image viewer:
Sar logs are well structured and Elasticsearch is a powerful tool to process logs
The older Sar versions simply don’t have an option to produce graphics. Still, Sar logs are well structured and Elasticsearch is a powerful tool to process logs in 2 easy steps:
1. Load Sar data into Elasticsearch.
2. Use Kibana to do all the visualizations and dashboards based on the data in Elasticsearch.
So how do we do it automatically?
By all means, there are many logs and we don’t want to do it manually after proof of the concept!
The answer is API and bash. We occasionally thought of writing API calls using Python or other full-featured language but bash proved to be more than enough for most cases.
We used 2 absolutely different APIs to do the task – the first API was Elasticsearch to load data and the second API was Kibana to create all the graphs and dashboards.
We have found that the Kibana API is less documented and we feel that more examples would benefit the community. As such, we provide all the API calls examples here. Each API call is a curl command referring to a JSON file. We shall provide both the curl command and the example JSON file for all the calls.
We have also utilized the Kibana concept of spaces to distinguish between logs from different servers. One space is only for one server. Ten servers mean ten Kibana spaces. Using spaces greatly reduces the risk of processing data for the wrong server.
Depending on which metric we process in the loop, we used the following commands on the Sar log referred to as the $file below.
for CPU:
sadf -d `echo $file`
for RAM:
sadf -d `echo $file` -- -r
for swap:
sadf -d `echo $file` -- -S
for IO:
sadf -d `echo $file` -- -b
for disks:
sadf -d $file -- -d -p
for network:
sadf -d $file -- -n DEV
Once we have output from one of the above commands or whatever other command we want to process further and vizualize, it’s time to create the indexes in ElasticSearch. Indexes are required so there is a place where we can upload sar data.
For example, the index for CPU data is created this way:
curl -XPUT -H'Content-Type:application/json' $ELASTIC_HOST:9200/sar.$METRIC.$HOSTNAME?pretty -d @create_index_$METRIC.json

$ cat create_index_cpu.json

{
  "mappings": {
    "properties": {
      "hostname":    { "type": "keyword" },
      "interval":  { "type": "integer"  },
      "timestamp":   {
        "type": "date",
        "format": "yyyy-MM-dd HH:mm:ss zzz"
      },
      "CPU":    { "type": "integer" },
      "%user":  { "type": "float"  },
      "%nice":   { "type": "float"  },
      "%system":    { "type": "float" },
      "%iowait":  { "type": "float"  },
      "%steal":   { "type": "float"  },
      "%idle":   { "type": "float"  }
    }
  }
}
Once the indexes for all the metrics are created, it’s time to upload Sar data into Elasticsearch indexes.
Bulk upload is the easiest way and below is an example JSON file for swap Sar data:
curl -H 'Content-Type: application/x-ndjson' -XPOST $ELASTIC_HOST:9200/_bulk?pretty --data-binary @interim.json

$ more interim.jso

{"index": {"_index": "sar.swap.server1.example.com "}}
{"hostname":"# hostname","interval":"interval","timestamp":"timestamp","kbswpfree":"kbswpfree"
,"kbswpused":"kbswpused","%swpused":"%swpused","kbswpcad":"kbswpcad","%swpcad":"%swpcad"}
{"index": {"_index": "sar.server1.example.com "}}
{"hostname":"SoftNAS-A83PR","interval":"595","timestamp":"2020-06-01 05:10:01 UTC","kbswpfree"
:"0","kbswpused":"4128764","%swpused":"100.00","kbswpcad":"23324","%swpcad":"0.56"}
{"index": {"_index": "server1.example.com"}}
{"hostname":"SoftNAS-A83PR","interval":"595","timestamp":"2020-06-01 05:20:01 UTC","kbswpfree"
:"0","kbswpused":"4128764","%swpused":"100.00","kbswpcad":"23324","%swpcad":"0.56"}
{"index": {"_index": "server1.example.com"}}
{"hostname":"SoftNAS-A83PR","interval":"595","timestamp":"2020-06-01 05:30:01 UTC","kbswpfree"
:"0","kbswpused":"4128764","%swpused":"100.00","kbswpcad":"23324","%swpcad":"0.56"}
All Elasticsearch work is done now. Data is uploaded to Elasticsearch indexes and we are switching to Kibana to create a few nice graphs.
First, we change the Kibana time format and Kibana time settings to how we like them.
The settings could be found in advanced settings in the Kibana UI but it’s easy to forget for any new Kibana installations:
curl -X POST -H "Content-Type: application/json" -H "kbn-xsrf: true" -d @change_time_format.json  http://$KIBANA_HOST:5601/s/$SPACE_ID/api/kibana/settings

curl -X POST -H "Content-Type: application/json" -H "kbn-xsrf: true" -d @change_time_zone.json  http://$KIBANA_HOST:5601/s/$SPACE_ID/api/kibana/settings

$ cat change_time_format.json
{"changes":{"dateFormat:scaled":"[\n  [\"\", \"HH:mm:ss.SSS\"],\n  [\"PT1S\", \"HH:mm:ss\"],\n  [\"PT1M\", \"MM-DD HH:mm\"],\n  [\"PT1H\", \"YYYY-MM-DD HH:mm\"],\n  [\"P1DT\", \"YYYY-MM-DD\"],\n  [\"P1YT\", \"YYYY\"]\n]"}}

$ cat change_time_zone.json
{
  "changes":{
    "dateFormat:tz":"Etc/GMT+5"
  }
}
Let’s create a Kibana space for each server
curl -X POST -H "Content-Type: application/json" -H "kbn-xsrf: true" -d @interim.json  http://$KIBANA_HOST:5601/api/spaces/space


$ cat interim.json
{
  "id": "server1.example.com",
  "name": "server1.example.com"
}
Now, the real Kibana work – create index patterns. The example shows json file for swap data:
curl -X POST -H "Content-Type: application/json" -H "kbn-xsrf: true" -d @interim.json  http://$KIBANA_HOST:5601/s/$SPACE_ID/api/saved_objects/index-pattern

$ cat interim.json
{
  "attributes":
    {
      "title": "sar.swap.server1.example.com *",
      "fields": "[{\"name\":\"kbswpfree\",\"type\":\"number\",\"esTypes\":[\"float\"],\"count\":0,\"scripted\":false,\"searchable\":true,\"aggregatable\":true,\"readFromDocValues\":true},{\"name\":\"kbswpused\",\"type\":\"number\",\"esTypes\":[\"float\"],\"count\":0,\"scripted\":false,\"searchable\":true,\"aggregatable\":true,\"readFromDocValues\":true},{\"name\":\"%swpused\",\"type\":\"number\",\"esTypes\":[\"float\"],\"count\":0,\"scripted\":false,\"searchable\":true,\"aggregatable\":true,\"readFromDocValues\":true},{\"name\":\"kbswpcad\",\"type\":\"number\",\"esTypes\":[\"float\"],\"count\":0,\"scripted\":false,\"searchable\":true,\"aggregatable\":true,\"readFromDocValues\":true},{\"name\":\"%swpcad\",\"type\":\"number\",\"esTypes\":[\"float\"],\"count\":0,\"scripted\":false,\"searchable\":true,\"aggregatable\":true,\"readFromDocValues\":true},{\"name\":\"swap\",\"type\":\"number\",\"esTypes\":[\"integer\"],\"count\":0,\"scripted\":false,\"searchable\":true,\"aggregatable\":true,\"readFromDocValues\":true},{\"name\":\"_id\",\"type\":\"string\",\"esTypes\":[\"_id\"],\"count\":0,\"scripted\":false,\"searchable\":true,\"aggregatable\":true,\"readFromDocValues\":false},{\"name\":\"_index\",\"type\":\"string\",\"esTypes\":[\"_index\"],\"count\":0,\"scripted\":false,\"searchable\":true,\"aggregatable\":true,\"readFromDocValues\":false},{\"name\":\"_score\",\"type\":\"number\",\"count\":0,\"scripted\":false,\"searchable\":false,\"aggregatable\":false,\"readFromDocValues\":false},{\"name\":\"_source\",\"type\":\"_source\",\"esTypes\":[\"_source\"],\"count\":0,\"scripted\":false,\"searchable\":false,\"aggregatable\":false,\"readFromDocValues\":false},{\"name\":\"_type\",\"type\":\"string\",\"esTypes\":[\"_type\"],\"count\":0,\"scripted\":false,\"searchable\":true,\"aggregatable\":true,\"readFromDocValues\":false},{\"name\":\"hostname\",\"type\":\"string\",\"esTypes\":[\"keyword\"],\"count\":0,\"scripted\":false,\"searchable\":true,\"aggregatable\":true,\"readFromDocValues\":true},{\"name\":\"interval\",\"type\":\"number\",\"esTypes\":[\"integer\"],\"count\":0,\"scripted\":false,\"searchable\":true,\"aggregatable\":true,\"readFromDocValues\":true},{\"name\":\"timestamp\",\"type\":\"date\",\"esTypes\":[\"date\"],\"count\":0,\"scripted\":false,\"searchable\":true,\"aggregatable\":true,\"readFromDocValues\":true}]"
    }
}
Create graphs, which are called visualizations in Kibana. The JSON file below is for one of the CPU graphs:
curl -X POST -H "Content-Type: application/json" -H "kbn-xsrf: true" -d @$METRIC.$HOSTNAME.$i.json http://$KIBANA_HOST:5601/s/$SPACE_ID/api/saved_objects/visualization


$ cat cpu.server1.example.com.%user.json
{
  "attributes":
    {
      "title": "sar-cpu-server1.example.com-%user",
      "visState": "{\"title\":\"%user\",\"type\":\"line\",\"params\":{\"type\":\"line\",\"grid\":{\"categoryLines\":false},\"categoryAxes\":[{\"id\":\"CategoryAxis-1\",\"type\":\"category\",\"position\":\"bottom\",\"show\":true,\"style\":{},\"scale\":{\"type\":\"linear\"},\"labels\":{\"show\":true,\"filter\":true,\"truncate\":100},\"title\":{}}],\"valueAxes\":[{\"id\":\"ValueAxis-1\",\"name\":\"LeftAxis-1\",\"type\":\"value\",\"position\":\"left\",\"show\":true,\"style\":{},\"scale\":{\"type\":\"linear\",\"mode\":\"normal\"},\"labels\":{\"show\":true,\"rotate\":0,\"filter\":false,\"truncate\":100},\"title\":{\"text\":\"Max %user\"}}],\"seriesParams\":[{\"show\":true,\"type\":\"line\",\"mode\":\"normal\",\"data\":{\"label\":\"%user\",\"id\":\"1\"},\"valueAxis\":\"ValueAxis-1\",\"drawLinesBetweenPoints\":true,\"lineWidth\":2,\"interpolate\":\"linear\",\"showCircles\":true}],\"addTooltip\":true,\"addLegend\":false,\"legendPosition\":\"right\",\"times\":[],\"addTimeMarker\":false,\"labels\":{},\"thresholdLine\":{\"show\":false,\"value\":10,\"width\":1,\"style\":\"full\",\"color\":\"#34130C\"},\"dimensions\":{\"x\":null,\"y\":[{\"accessor\":0,\"format\":{\"id\":\"number\"},\"params\":{},\"aggType\":\"count\"}]}},\"aggs\":[{\"id\":\"1\",\"enabled\":true,\"type\":\"max\",\"schema\":\"metric\",\"params\":{\"field\":\"%user\"}},{\"id\":\"2\",\"enabled\":true,\"type\":\"date_histogram\",\"schema\":\"segment\",\"params\":{\"field\":\"timestamp\",\"useNormalizedEsInterval\":true,\"scaleMetricValues\":false,\"interval\":\"10m\",\"drop_partials\":false,\"min_doc_count\":1,\"extended_bounds\":{}}}]}",
      "uiStateJSON": "{}",
      "description": "",
      "version": 1,
      "kibanaSavedObjectMeta": {
        "searchSourceJSON": "{\"query\":{\"query\":\"\",\"language\":\"kuery\"},\"filter\":[],\"indexRefName\":\"kibanaSavedObjectMeta.searchSourceJSON.index\"}"
      }
    },
  "references": [
      {
        "name": "kibanaSavedObjectMeta.searchSourceJSON.index",
        "type": "index-pattern",
        "id": "2a5ed4b0-b451-11ea-a8db-210d095de476"
      }
    ]

}
We are pretty much done but we could have generated dozens of graphs by now, so lets make a few dashboards to organize graphs by metric, meaning one dashboard for CPU, one for RAM, one for each disks, etc:
curl -X POST -H "Content-Type: application/json" -H "kbn-xsrf: true" -d @$INTERIM_FILE http://$KIBANA_HOST:5601/s/$SPACE_ID/api/saved_objects/dashboard

{
  "attributes":
    {
      "title": "sar-swap-server1.example.com",
      "hits": 0,
      "description": "",
      "panelsJSON": "[{\"version\":\"7.5.1\",\"gridData\":{\"w\":12,\"h\":8,\"x\":0,\"y\":0,\"i\":\"sar-swap-softnas-a83pr-kbswpfree\"},\"panelIndex\":\"sar-swap-softnas-a83pr-kbswpfree\",\"embeddableConfig\":{},\"panelRefName\":\"panel_0\"},{\"version\":\"7.5.1\",\"gridData\":{\"w\":12,\"h\":8,\"x\":12,\"y\":0,\"i\":\"sar-swap-softnas-a83pr-kbswpused\"},\"panelIndex\":\"sar-swap-softnas-a83pr-kbswpused\",\"embeddableConfig\":{},\"panelRefName\":\"panel_1\"},{\"version\":\"7.5.1\",\"gridData\":{\"w\":12,\"h\":8,\"x\":24,\"y\":0,\"i\":\"sar-swap-softnas-a83pr-%swpused\"},\"panelIndex\":\"sar-swap-softnas-a83pr-%swpused\",\"embeddableConfig\":{},\"panelRefName\":\"panel_2\"},{\"version\":\"7.5.1\",\"gridData\":{\"w\":12,\"h\":8,\"x\":36,\"y\":0,\"i\":\"sar-swap-softnas-a83pr-kbswpcad\"},\"panelIndex\":\"sar-swap-softnas-a83pr-kbswpcad\",\"embeddableConfig\":{},\"panelRefName\":\"panel_3\"},{\"version\":\"7.5.1\",\"gridData\":{\"w\":12,\"h\":8,\"x\":48,\"y\":0,\"i\":\"sar-swap-softnas-a83pr-%swpcad\"},\"panelIndex\":\"sar-swap-softnas-a83pr-%swpcad\",\"embeddableConfig\":{},\"panelRefName\":\"panel_4\"}]",
      "optionsJSON": "{\"useMargins\":true,\"hidePanelTitles\":false}",
      "version": 1,
      "timeRestore": false,
      "kibanaSavedObjectMeta": {
        "searchSourceJSON": "{\"query\":{\"query\":\"\",\"language\":\"kuery\"},\"filter\":[]}"
      }


    },
    "references": [

      {
        "name": "panel_0",
        "type": "visualization",
        "id": "56224aa0-b451-11ea-a8db-210d095de476"
      },
      {
        "name": "panel_1",
        "type": "visualization",
        "id": "56b95a80-b451-11ea-a8db-210d095de476"
      },
      {
        "name": "panel_2",
        "type": "visualization",
        "id": "5752db60-b451-11ea-a8db-210d095de476"
      },
      {
        "name": "panel_3",
        "type": "visualization",
        "id": "57ec5c40-b451-11ea-a8db-210d095de476"
      },
      {
        "name": "panel_4",
        "type": "visualization",
        "id": "58865250-b451-11ea-a8db-210d095de476"
      }
    ]

}
JSON files often look scary, but they are not actually. Once the desired object is created manually in Kibana UI, the json could be found and copy-and-paste is easily applied with only a minor editing or auto replacement.
Just a few more API calls are required while coding all the visualizations and dashboards:
Get index pattern id:
curl -X GET -H "Content-Type: application/json" -H "kbn-xsrf: true" http://$KIBANA_HOST:5601/s/$SPACE_ID/api/saved_objects/_find?type=index-pattern&fields=title
Get visualization id:
curl -X GET -H "Content-Type: application/json" -H "kbn-xsrf: true" "http://$KIBANA_HOST:5601/s/$SPACE_ID/api/saved_objects/_find?type=visualization&per_page=1000"
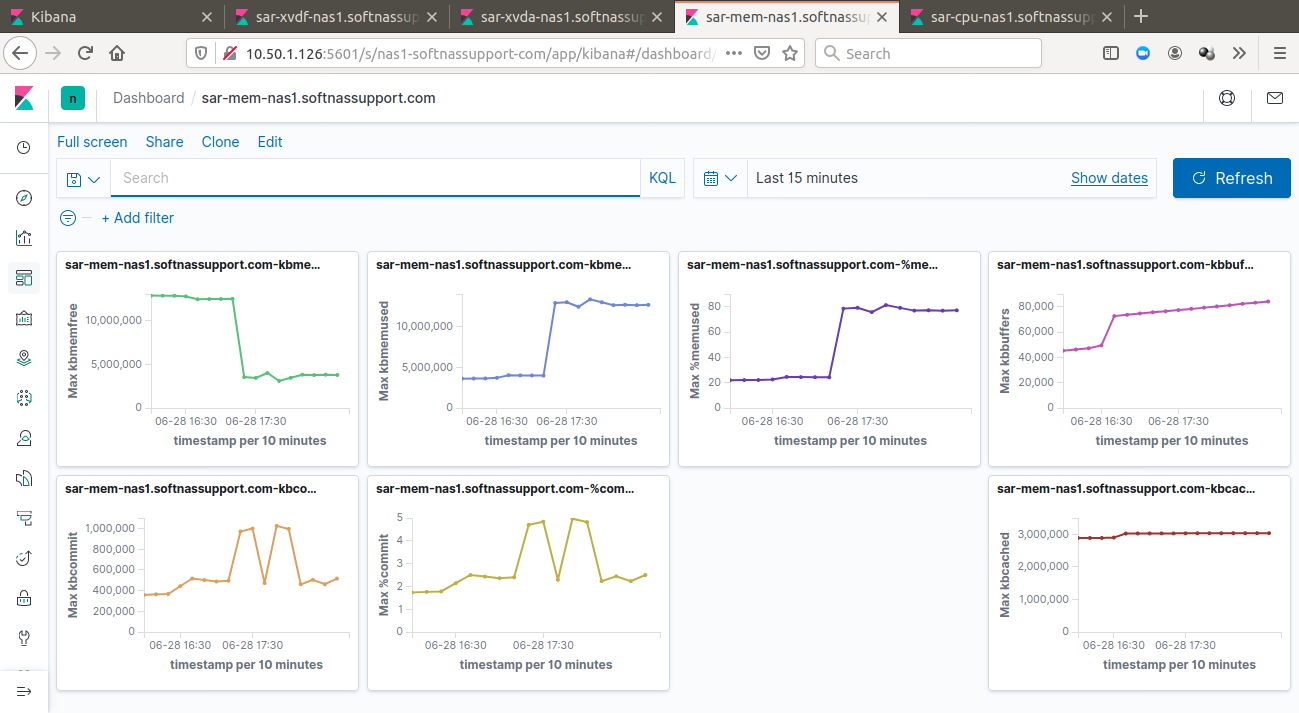
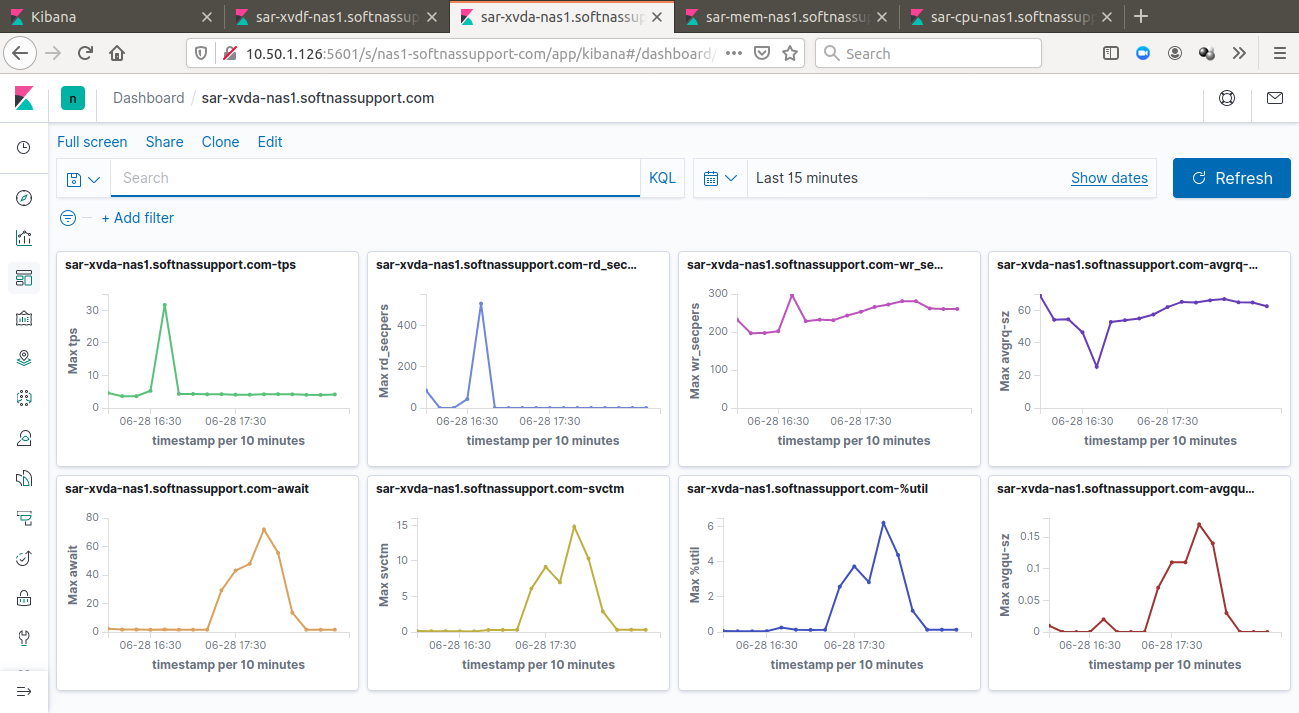
Lets enjoy the newly created dashboards!
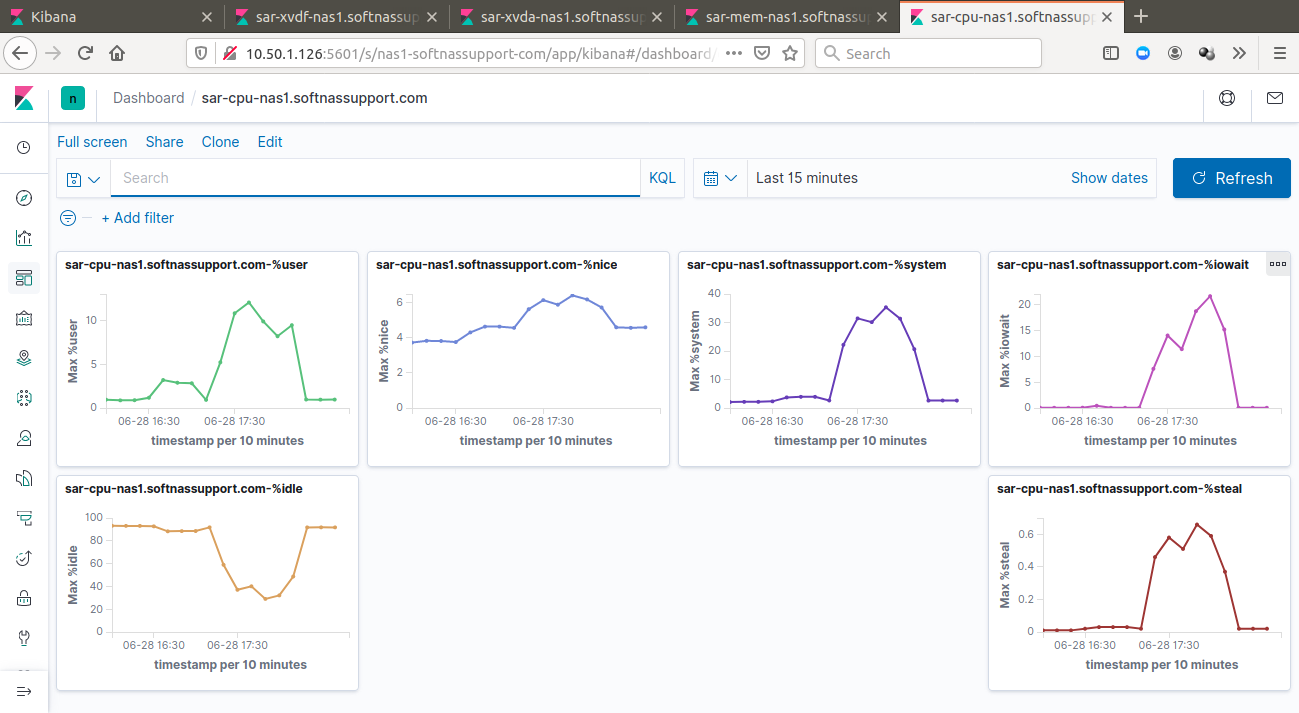
The CPU dashboard shows a spike related to a massive data copy operation:


