SoftNAS storage solutions for SAP HANA

SoftNAS storage solutions for SAP HANA

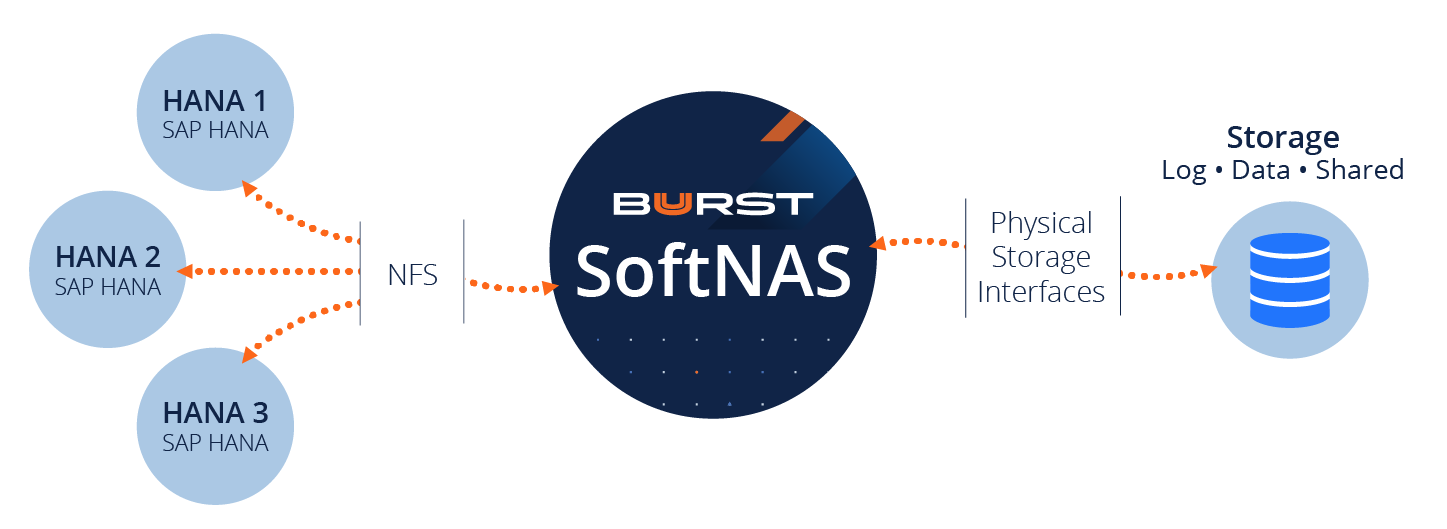
As we all know, one of the most critical parts of any system is storage. Buurst SoftNAS provides cloud storage performance to SAP HANA. This blog post will make it easier for you to understand the options available to SoftNAS and SAP HANA to improve data performance and reduce your environment’s complexity. You will also learn how to choose specific storage options for their SAP HANA environment.

SAP HANA is a platform for data analysis and business analytics. HANA can provide insights from your data—faster than traditional RDMS systems. Performance is essential for SAP HANA because it helps to provide information more quickly. SAP HANA is optimized to work with real-time data, so performance is a significant factor.

Top 5 reasons to choose Buurst SoftNAS SAP HANA

1. Superior performance for processing data
2. Maximum scale to process as much data as possible
3. High reliability
4. Low cost
5. Integration into existing infrastructure

All data and metadata for the SAP HANA system are in shared objects. These objects are copied from data tables to logical tables and accessed by SAP HANA software. So, as this information is grown, the impact on performance grows as well. By using SoftNAS to address performance bottlenecks, SoftNAS can accelerate operations that otherwise might be less efficient.

For example, the copy operation will undoubtedly be faster if you deploy storage with read-cache. Read cache is implemented with NVMe or SSD drives and helps copy the parameters from source tables to specialization indexes. Tables are frequently written, such as ETL operations, the technique of storing data and logs in SoftNAS reduces the complexity and resiliency, which reduces the overall risk for data loss. Cloud NAS can also improve your data requests’ response times and other critical factors like resource management and disaster recovery.

Storing your data and logs volumes on a NAS would certainly improve resilience. Using a NAS with RAID also allows for added redundancy if something goes wrong with one of your drives. Utilizing RAID will not only help to ensure your data is safe, but it will also allow you to maintain a predictable level of performance when it comes time to scale up your software.

Partitioning of data volumes allows for efficient data distribution and high availability. Partitioning will also help you scale up your SAP HANA performance, which can be a challenge with only one large storage pool. Partitioning will involve allocating more than one volume to each table and moving the information across volumes over time.

SAP HANA supports persistent memory for database tables. Persistent memory retains data in memory between server reboots. Loading data requires time to boot and load the data and then refresh the data. With SAP HANA deployed with SoftNAS storage, loading times are not a problem at all. The amount of data you consume will significantly benefit from persistence memory. While reading (basically accessing) records from persistent memory takes a long time, writing to the memory works much better with SoftNAS.

SoftNAS data snapshots enable SAP HANA backup multiple times a day without the overhead of file-based solutions, eliminating the need for lengthy consistency check times when backing up and dramatically reducing the time to restore the data. Schedule multiple backups a day with restore and recovery operations in a matter of minutes.

CPU and IO offloading help to support high-performance data processing. Reducing CPU and IO overhead effectively serves to increase database performance. By moving backup processes into the storage network, we can free up server resources to enable higher throughput and a lower Total Cost of Ownership (TCO).

You want to deploy SAP HANA because your business needs access to real-time information that allows you to make timely decisions with maximal value. SoftNAS is a cloud NAS that will enable you to develop real-time business applications, connecting your company with customers, partners, and employees in ways that you have never imagined before.

Designing your storage to meet cost and performance goals

Designing your storage to meet cost and performance goals

Scalability, virtualization, efficiency, and reliability are major Cloud Platform design goals of a cloud computing platform. Public cloud platforms like AWS and Azure offer a few different choices for persistent storage. Today I’m going to show you how to leverage a SoftNAS NAS storage appliance with these different storage types to scale your application to meet your specific performance and cost goals in the public cloud.

To get started, let’s take a quick look at these storage types in both AWS and Azure to understand their characteristics. The high-performance disk types are more expensive, and the cost decrease as the performance level decreases.  Refer to the below table for a quick reference.

References below:

Azure storage types

Amazon EBS volume types

Because I’m going to use a SoftNAS as my primary storage controller in AWS or Azure, I can take advantage of all of the different disk types available on those platforms and design storage pools that meet each of my application performance and cost goals. I can create pools using high-performance devices along with pools that utilize magnetic media and object storage. I can even create tiered pools that utilize both SSD and HDD. Along with the flexibility of using different media types for my storage architecture, I can leverage the extra benefits of caching, snapshots, and file system replication that come along with using SoftNAS. There are tons of additional features that I could mention, but for this blog post, I’m only going to focus on the types of pools I can create and how to leverage the different disk types.

High-Performance Pools

I’ll use AWS in this example. For an application that requires low latency and high IOPs, we would think about using SSDs like IO1 or GP2 as the underlying medium. Let’s say we need our application to have 9k available IOPs and at least 2TB of available storage. We can aggregate the devices in a pool to get the sum throughput and IO of all the devices combined, or we can provide a single IO Optimized volume to achieve the performance target. Let’s look at the underlying math and figure out what we should do.

We know that AWS GP2 EBS gives us 3 IOPs per GB of storage. With that in mind, 2TB would only give us 6k IOPs. That’s 3k short of our performance goal. To reach the 9k IOPs requirement, we would either need to provision 3TB of GP2 EBS disk or provision an IO Optimized (IO1) EBS disk and set the IOPS to 9k for that device.


Any of the below configurations would allow you to achieve this benchmark using Buurst’s SoftNAS.

Throughput Optimized Pools

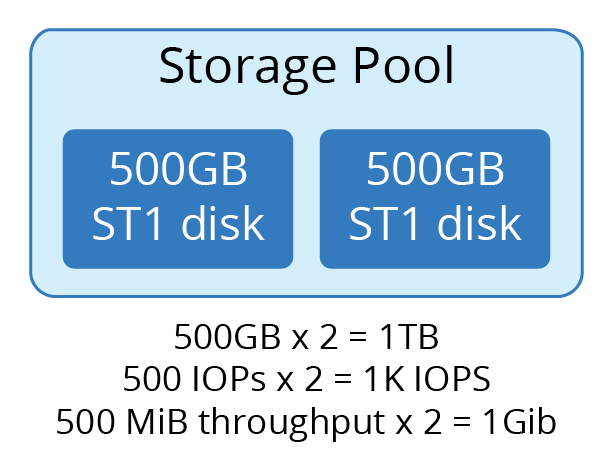
If your storage IO specification does not require low latency but does require a higher throughput level, then ST1 Type EBS may work well for you. ST1 disk types are going to be less expensive than the GP2 or IO1 type of devices. The same rules apply regarding aggregating the throughput of the devices to achieve your throughput requirements. If we look at the specs for ST1 devices (link above), we are allowed up to 500 IOP’s per device and a max of 500 MiB of throughput per device. If we require a 1TB volume to achieve 1GiB of throughput and 1000 IOPs, then we can design a pool with those requirements as well. It may look something like below:

Pools for Archive and Less Frequently Accessed Data

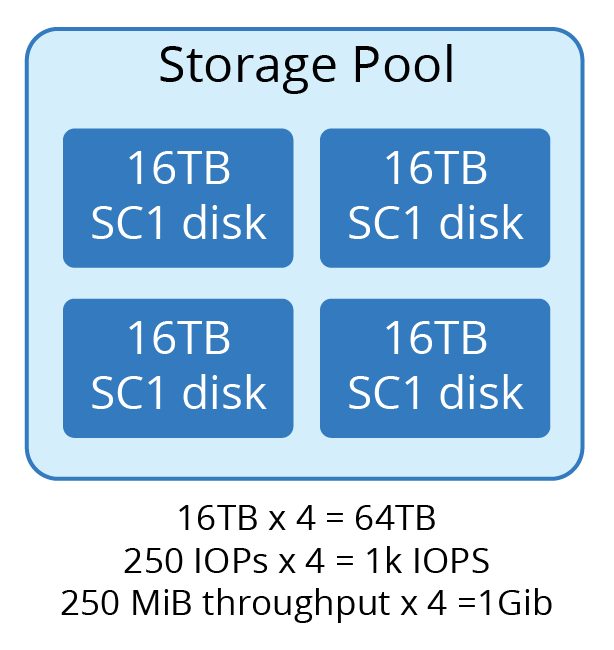
If you require storing backups on disk or have a data set that is not frequently accessed, then you could save money by storing this data set on less expensive storage. Your options are going to be magnetic media or object storage. SoftNAS can also help you out with that. HDD in Azure or SC1 in AWS are good options for this. You can combine devices to achieve high capacity requirements for this infrequently accessed or archival data. The throughput limits on the HDD type devices are limited to 250MiB, but the capacity is higher, and the cost is much less when compared to SSD type devices. If we needed 64TB of cold storage in AWS, it might look like below. The largest device in AWS is 16TB, so that we will use four.

Tiered Pools

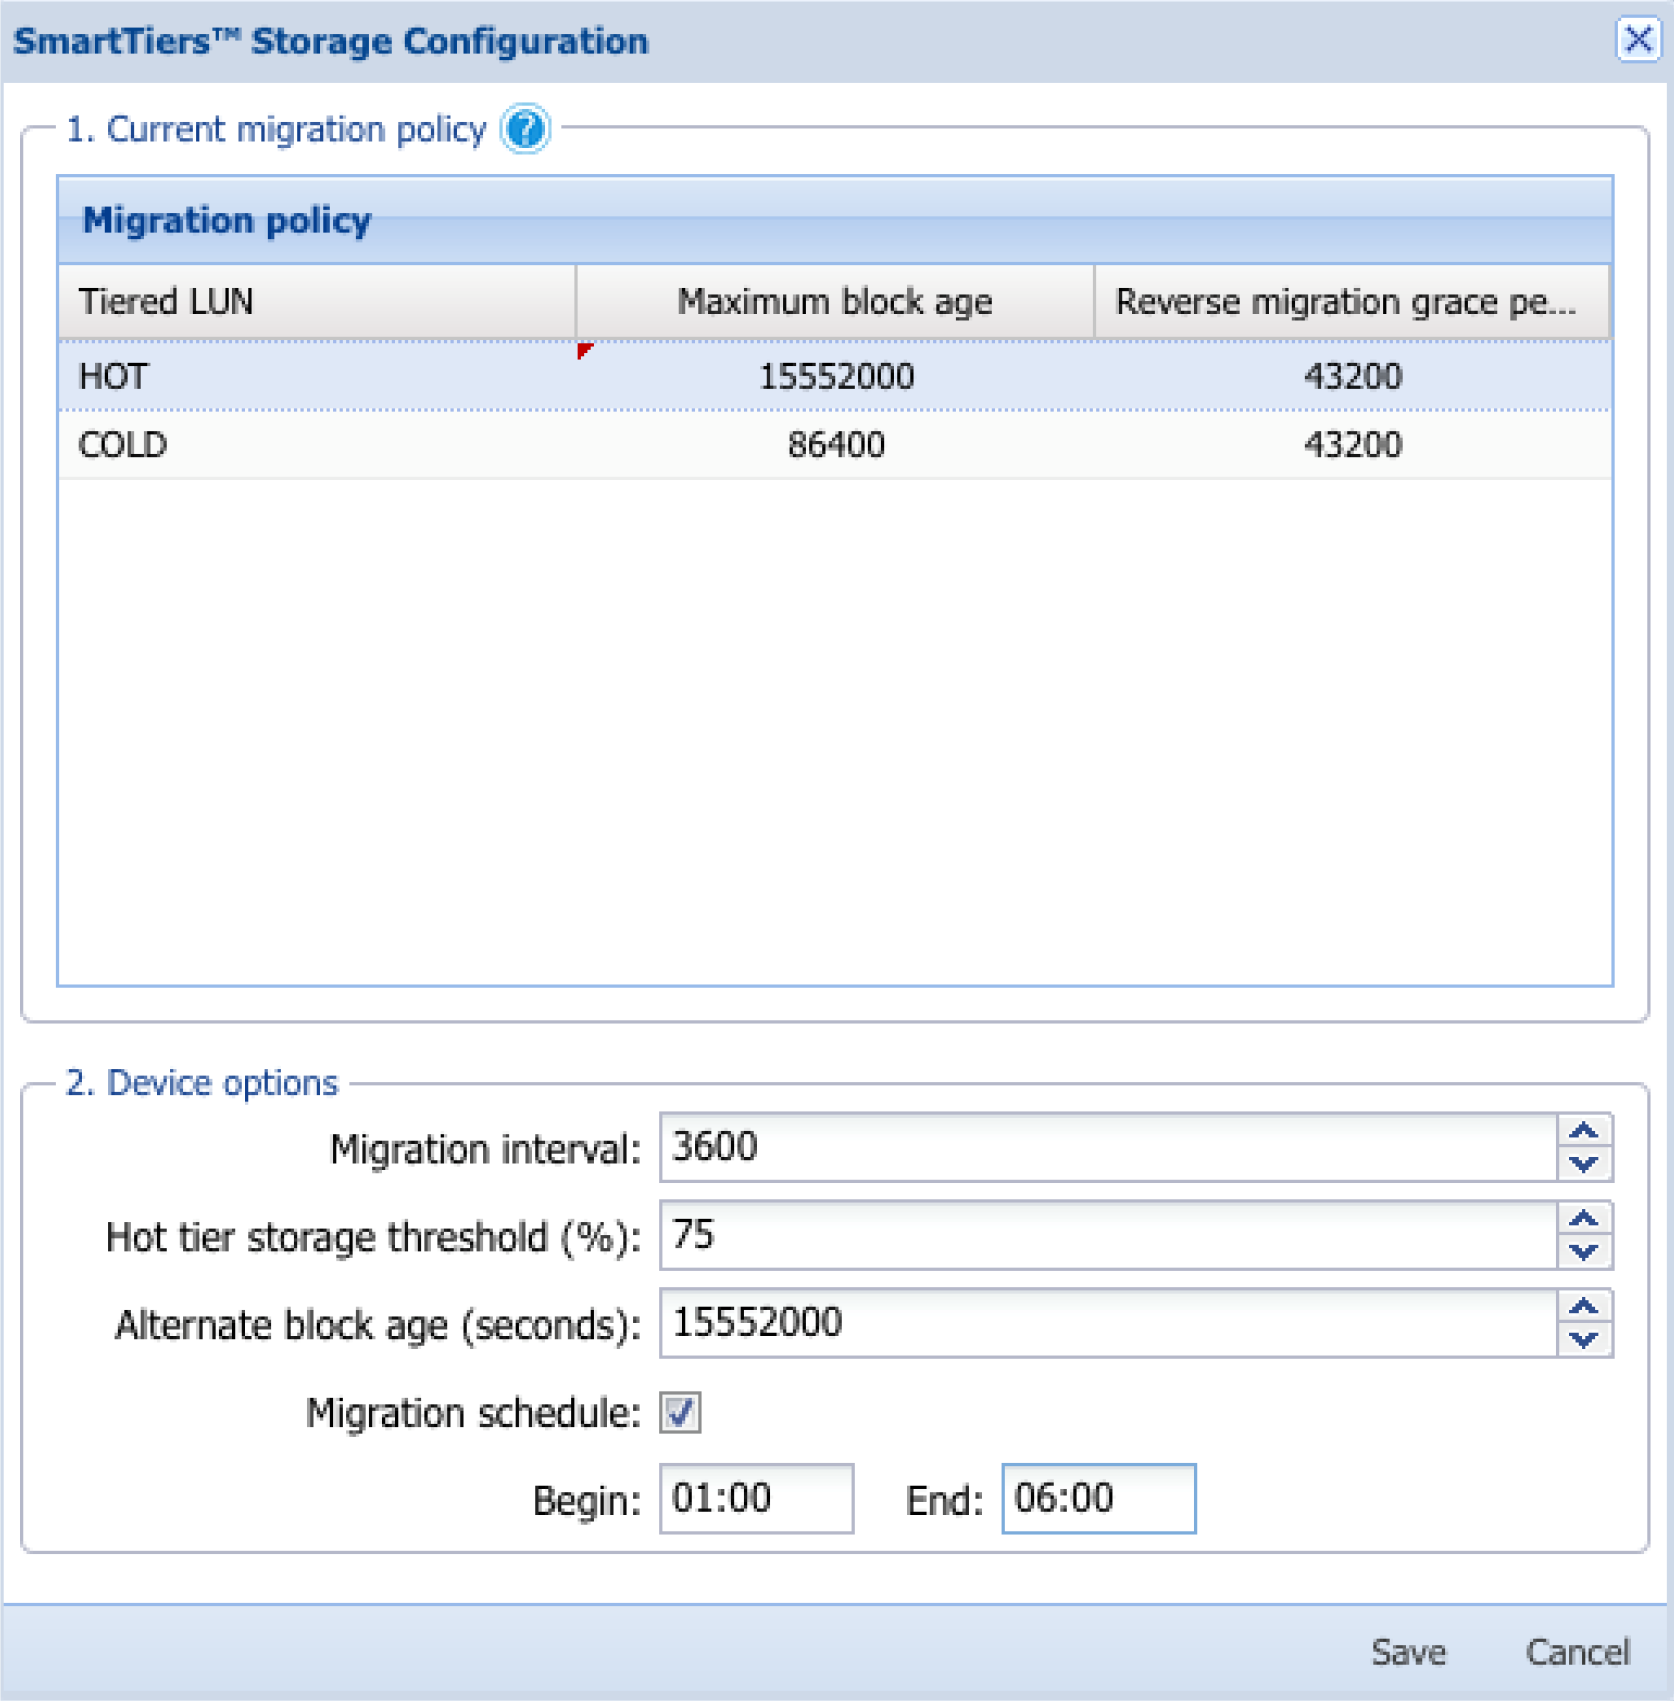
Finally, I will mention Tiered Pools. Tiered pools are a feature you can use in BUURST™ SoftNAS, whereby you can have different levels of performance all within the same pool. When you set up a tiered pool on SoftNAS, you can have a ‘hot’ tier made of fast SSD devices along with a ‘cold’ tier that is made of slower, less expensive HDD devices. You set block-level age policies that enable the less frequently accessed data to migrate down to the cold tier HDD devices while your frequently accessed data will remain in the hot tier on the SSD devices. Let’s say we want to provision 20TB of storage. We think that about 20% of our data would be active at any time, and the other 80% could be on cold storage. An example of what that tiered pool may look like is below.

The tier migration policy has the following configuration:

  • Maximum block age: Age limit of blocks in seconds.
  • Reverse migration grace period: If a block is requested from the lower tier within this period, it will be migrated back up.
  • Migration interval: Time in seconds between checks.
  • Hot tier storage threshold: If the hot tier fills to this level, data is migrated off.
  • Alternate Block Age: Addition age to migrate blocks in the case of HOT tier becoming full.

Summary

If you are looking for a way to tune your storage pools based on your application requirements, then you should try SoftNAS. It gives you the flexibility to leverage and combine different storage mediums to achieve the cost, performance, and scalability that you are looking for. Feel free to reach out to BUURST™ sales team for more information.

Mounting iSCSI inside SoftNAS to copy data using rsync

Mounting iSCSI inside SoftNAS to copy data using rsync

In this blog post, we are going to discuss how to mount ZFS iSCSI LUNs that have already been formatted with NTFS inside SoftNAS to access data. This use case is mostly applicable in VMware environments where you have a single SoftNAS node on failing hardware and want to quickly migrate your data to a newer version of SoftNAS using rsync. However, this can also be applied to different iSCSI data recovery scenarios.


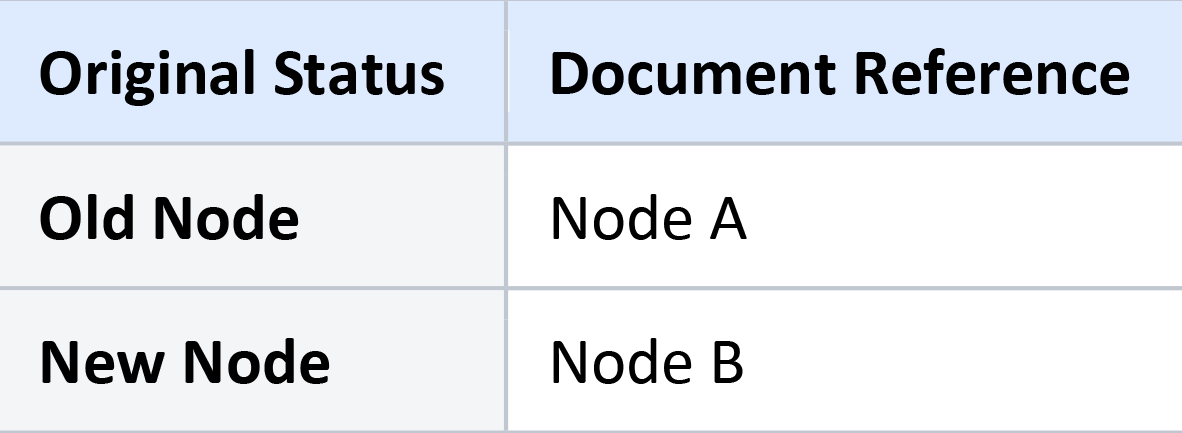
For the purposes of this Blog post, the following terminology will be used:

At this point, we assumed we already have our new SoftNAS (Node B) deployed, configured our pool and iSCSI LUN, and ready to receive the rsync stream from Node A. So we won’t be discussing that as that is not the main focus of this blog post

That said, let’s get started!

1. On Node B, do the following:

From UI go to Settings –> General System Settings –> Servers –> SSH Server –> Authentication –> and change Allow authentication by password? to “YES” and Allow login by root? to “YES”

Restart ssh server

NOTE: Please take note of these changes as you will need to revert them back to their defaults for security reasons

2. From Node A, set up SSH keys to push to Node B to allow a seamless rsync experience

Let’s set up SSH keys to push to Node B to allow a seamless rsync experience. After this step, we should be able to connect to Node B using  root@Node-B-IP without requiring a password. However, if a passphrase was set, you will be required to provide the passphrase every time you try to connect via ssh. So in the interest of convenience and time don’t use a passphrase. Just leave it blank:

a. Create the RSA Key Pair:
# ssh-keygen -t rsa -b 2048

b. Use default location /root/.ssh/id_rsa and setup passphrase if required.

c. The public key is now located in /root/.ssh/id_rsa.pub

d. The private key (identification) is now located in /root/.ssh/id_rsa

3. Copy the public key to Node B

Using the ssh-copy-id command. Where user and IP address should be replaced with node B’s credentials.

Example:

# ssh-copy-id root@10.0.2.97

Alternatively, copy the content of /root/.ssh/id_rsa.pub to /root/.ssh/authorized_keys on the second server.

Now we are ready to mount our iSCSI volume on Node A and node B respectively. A single volume on each node is used on this blog post but the steps apply to multiple iSCSI volumes as well.

Before we proceed, please make sure that no ZFS iSCSI LUNs are mounted in Windows before proceeding to step #4 if not all NTFS volumes will mount as read-only inside SoftNAS Cloud NAS which is not what we really want. This is because our current iSCSI implementation doesn’t allow Multipath at the same time.

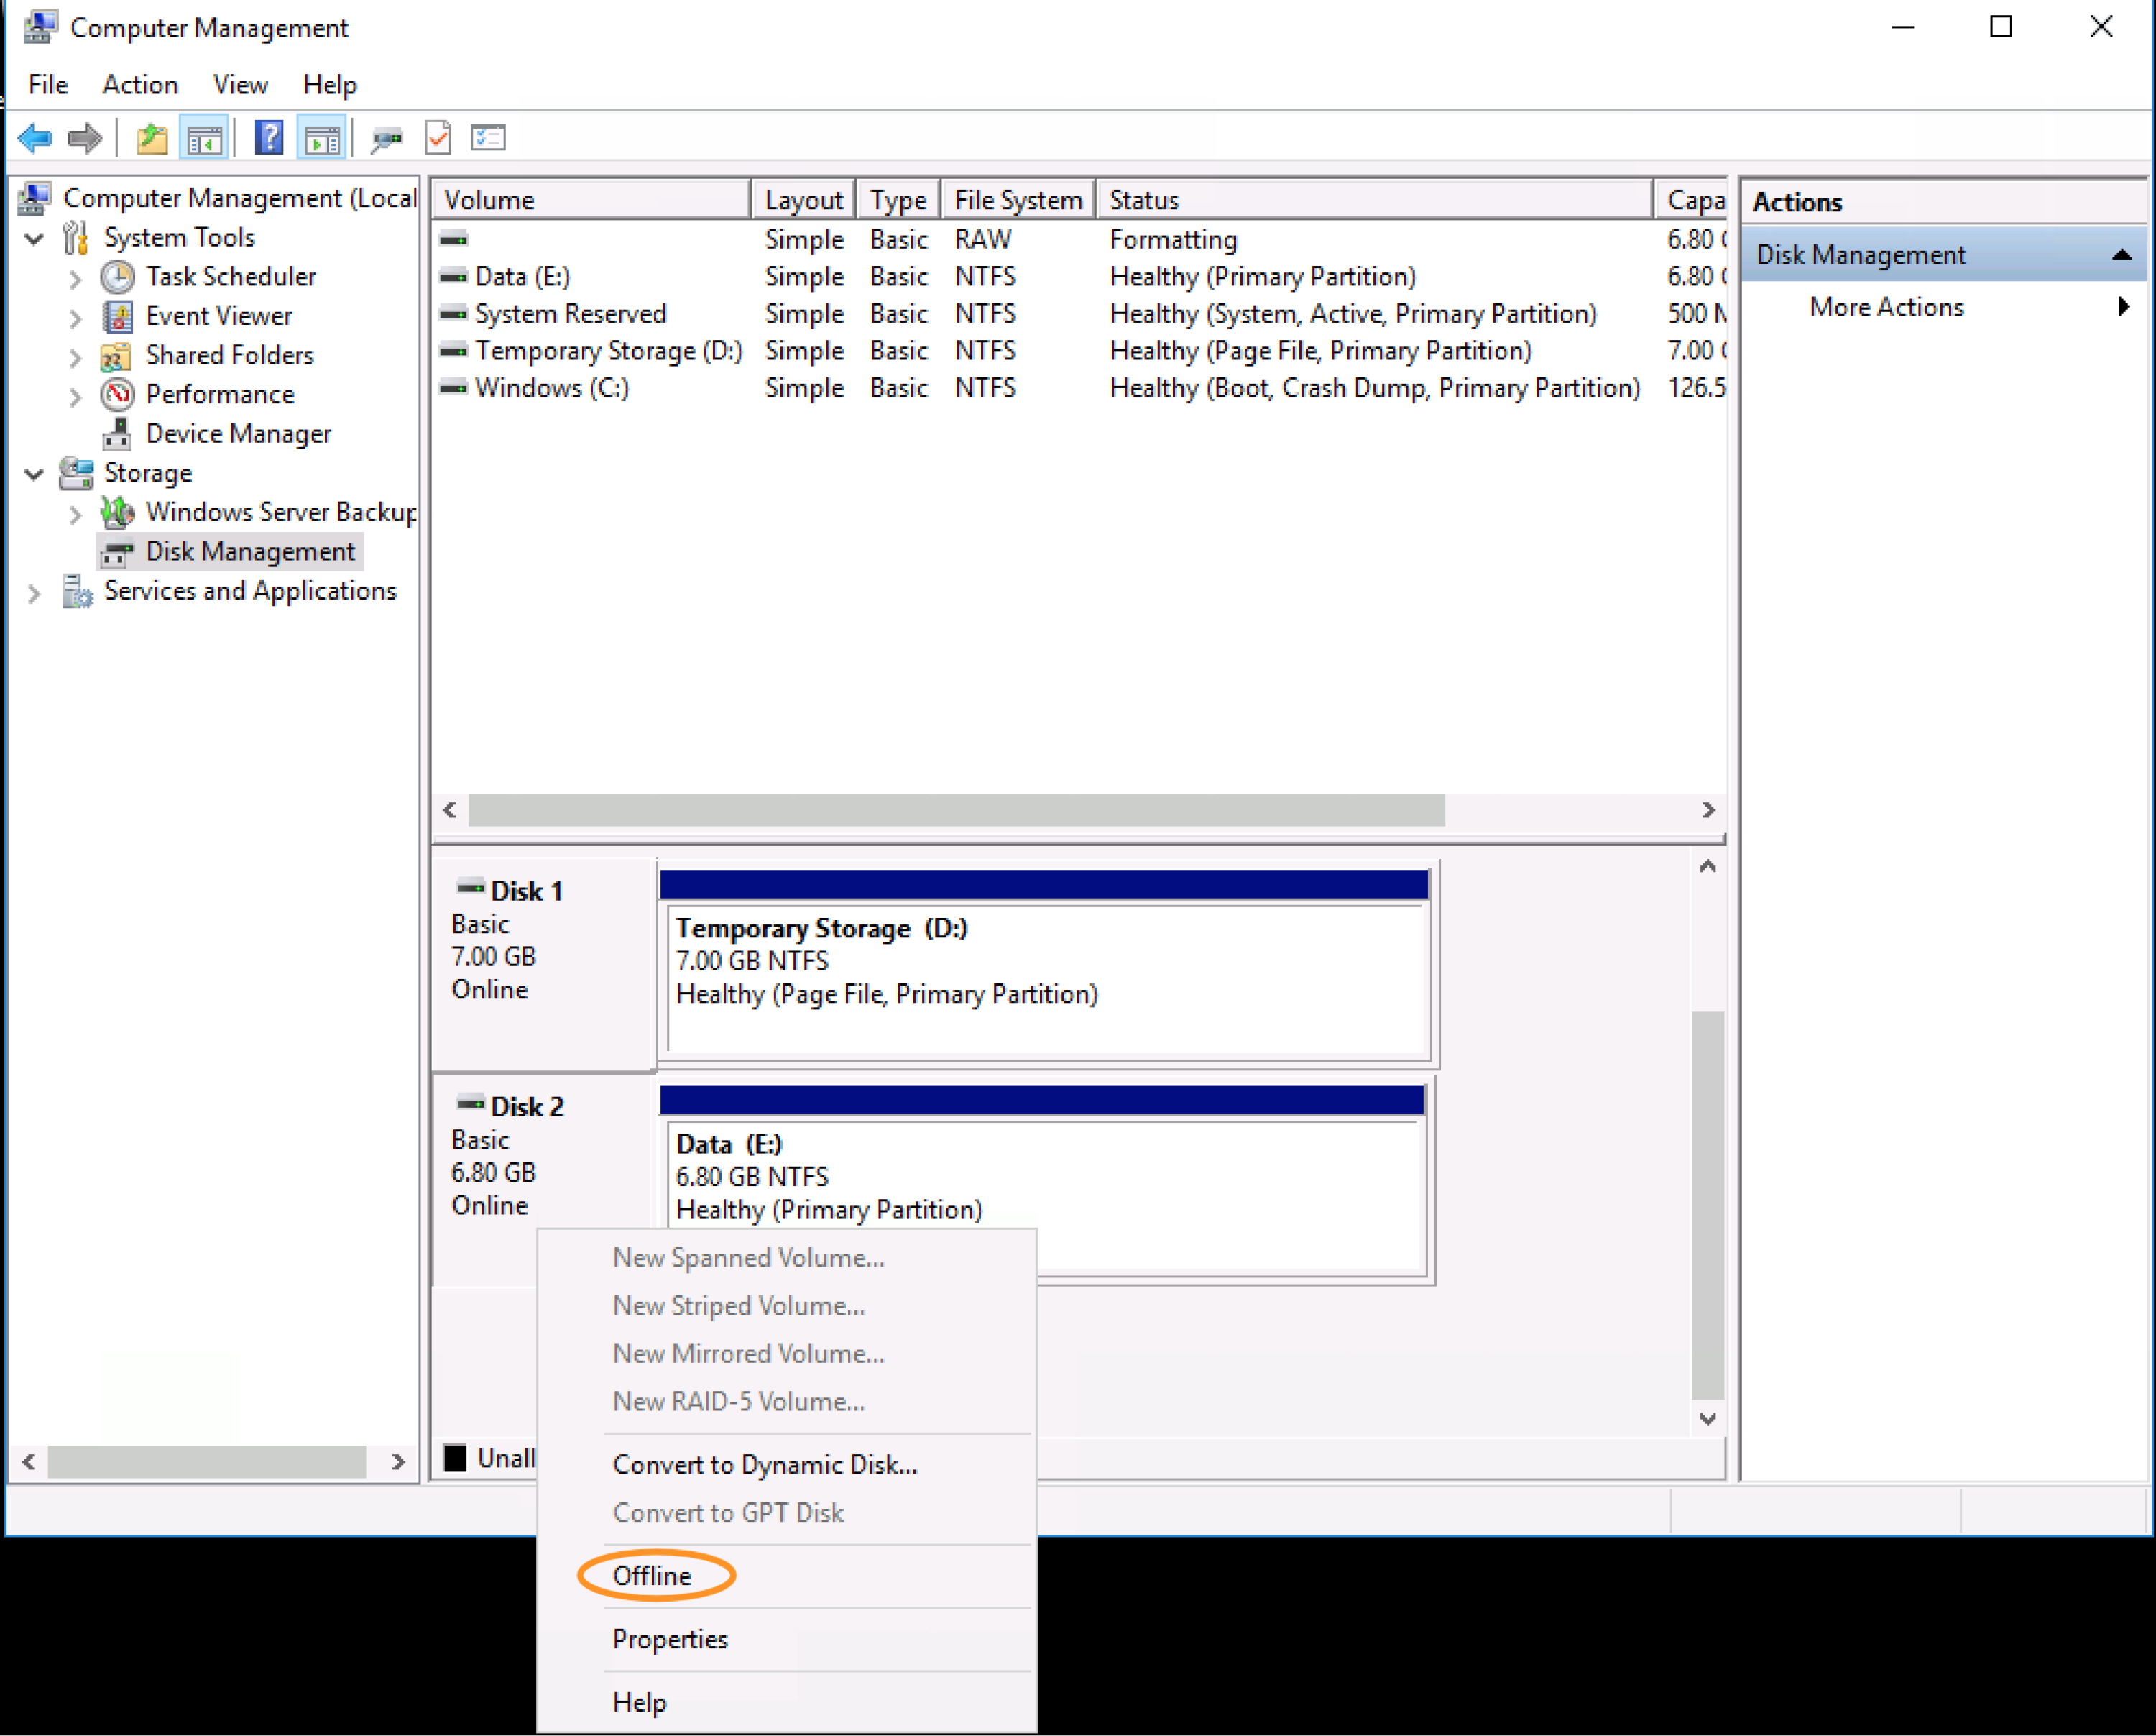
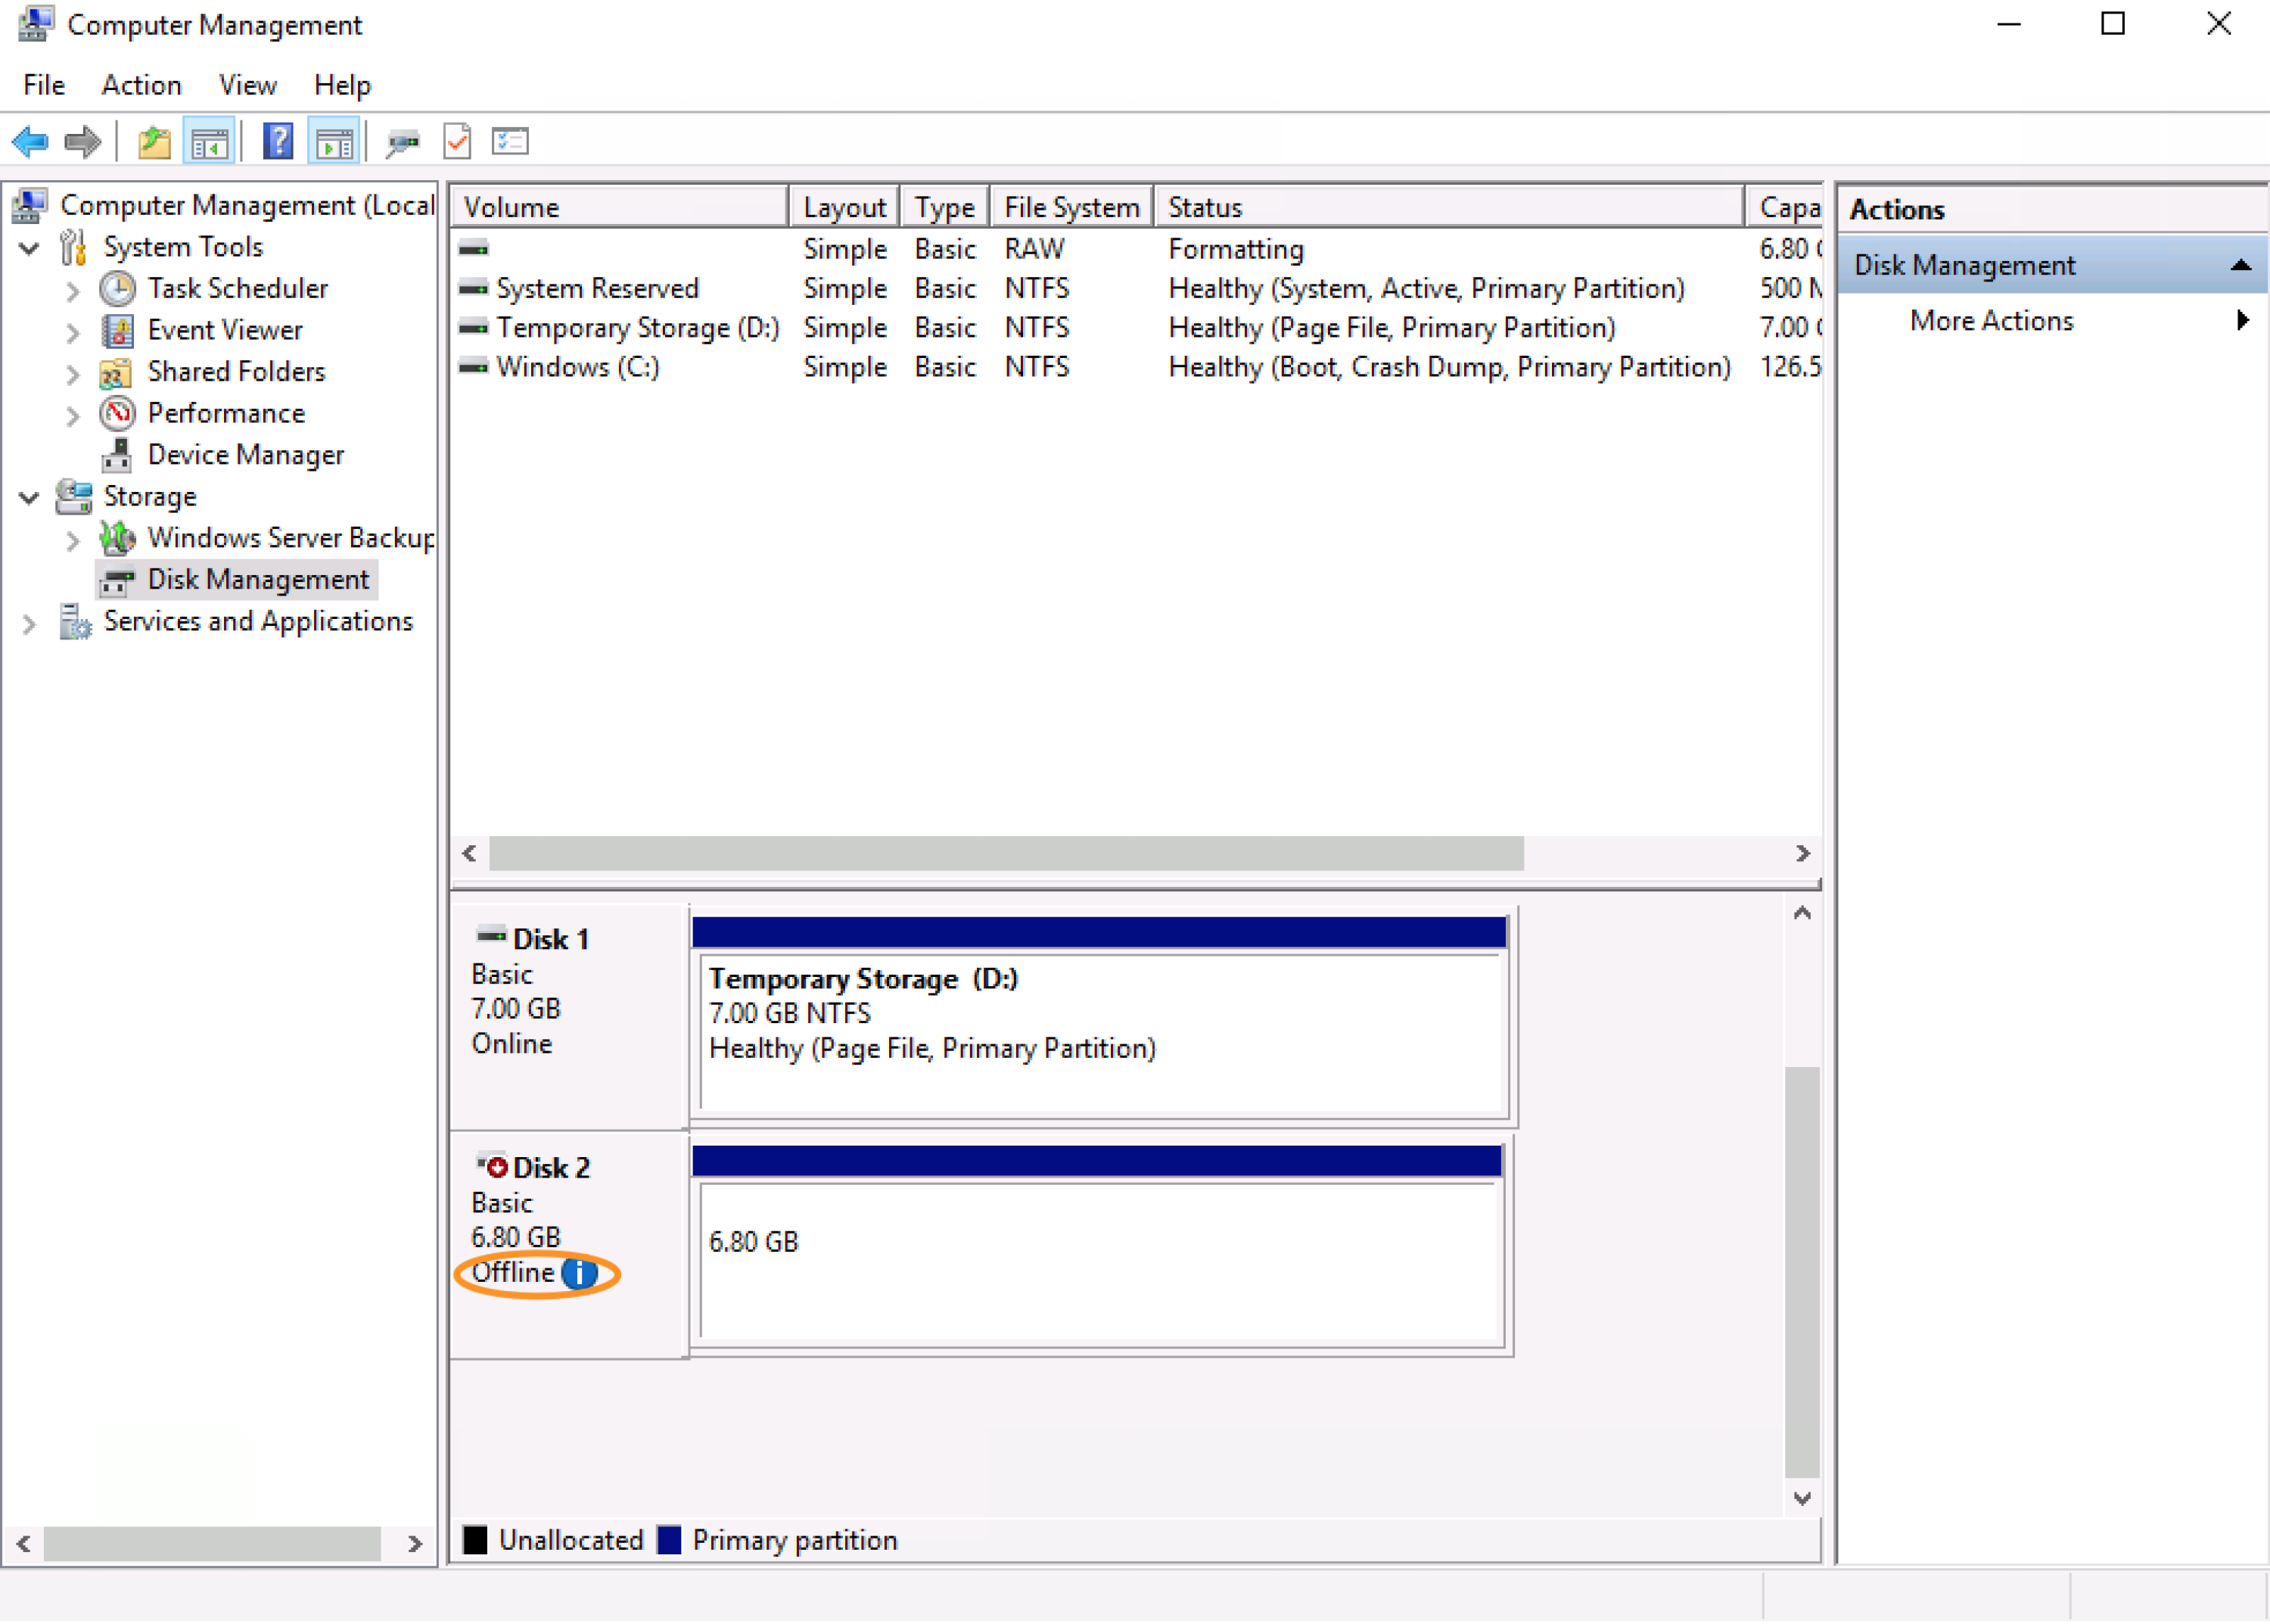
To unmount we can simply head over to “Computer Management” in Windows –> right-click on the iSCSI LUN and click “Offline”. Please see the screenshots below for reference

4. Mount the NTFS LUN inside SoftNAS

We need to install the package below on both Node A and Node B to allow us to mount the NTFS LUN inside SoftNAS/Buurst.

# yum install -y ntfs-3g

5. log in to the iSCSI LUN

Now from the CLI on Node A let’s login to the iSCSI LUN. We’ll run the commands below respectively while substituting the IP and the Target’s name with correct values from Node A:

# iscsiadm -m discovery -t st –portal 10.10.1.4

# iscsiadm -m node -T iqn.2020-07.com.softnas:storage.target1 -P 10.10.1.4 -l

Successfully executing the commands above will present you with the screenshot below:

6. iSCSI disk on Node A

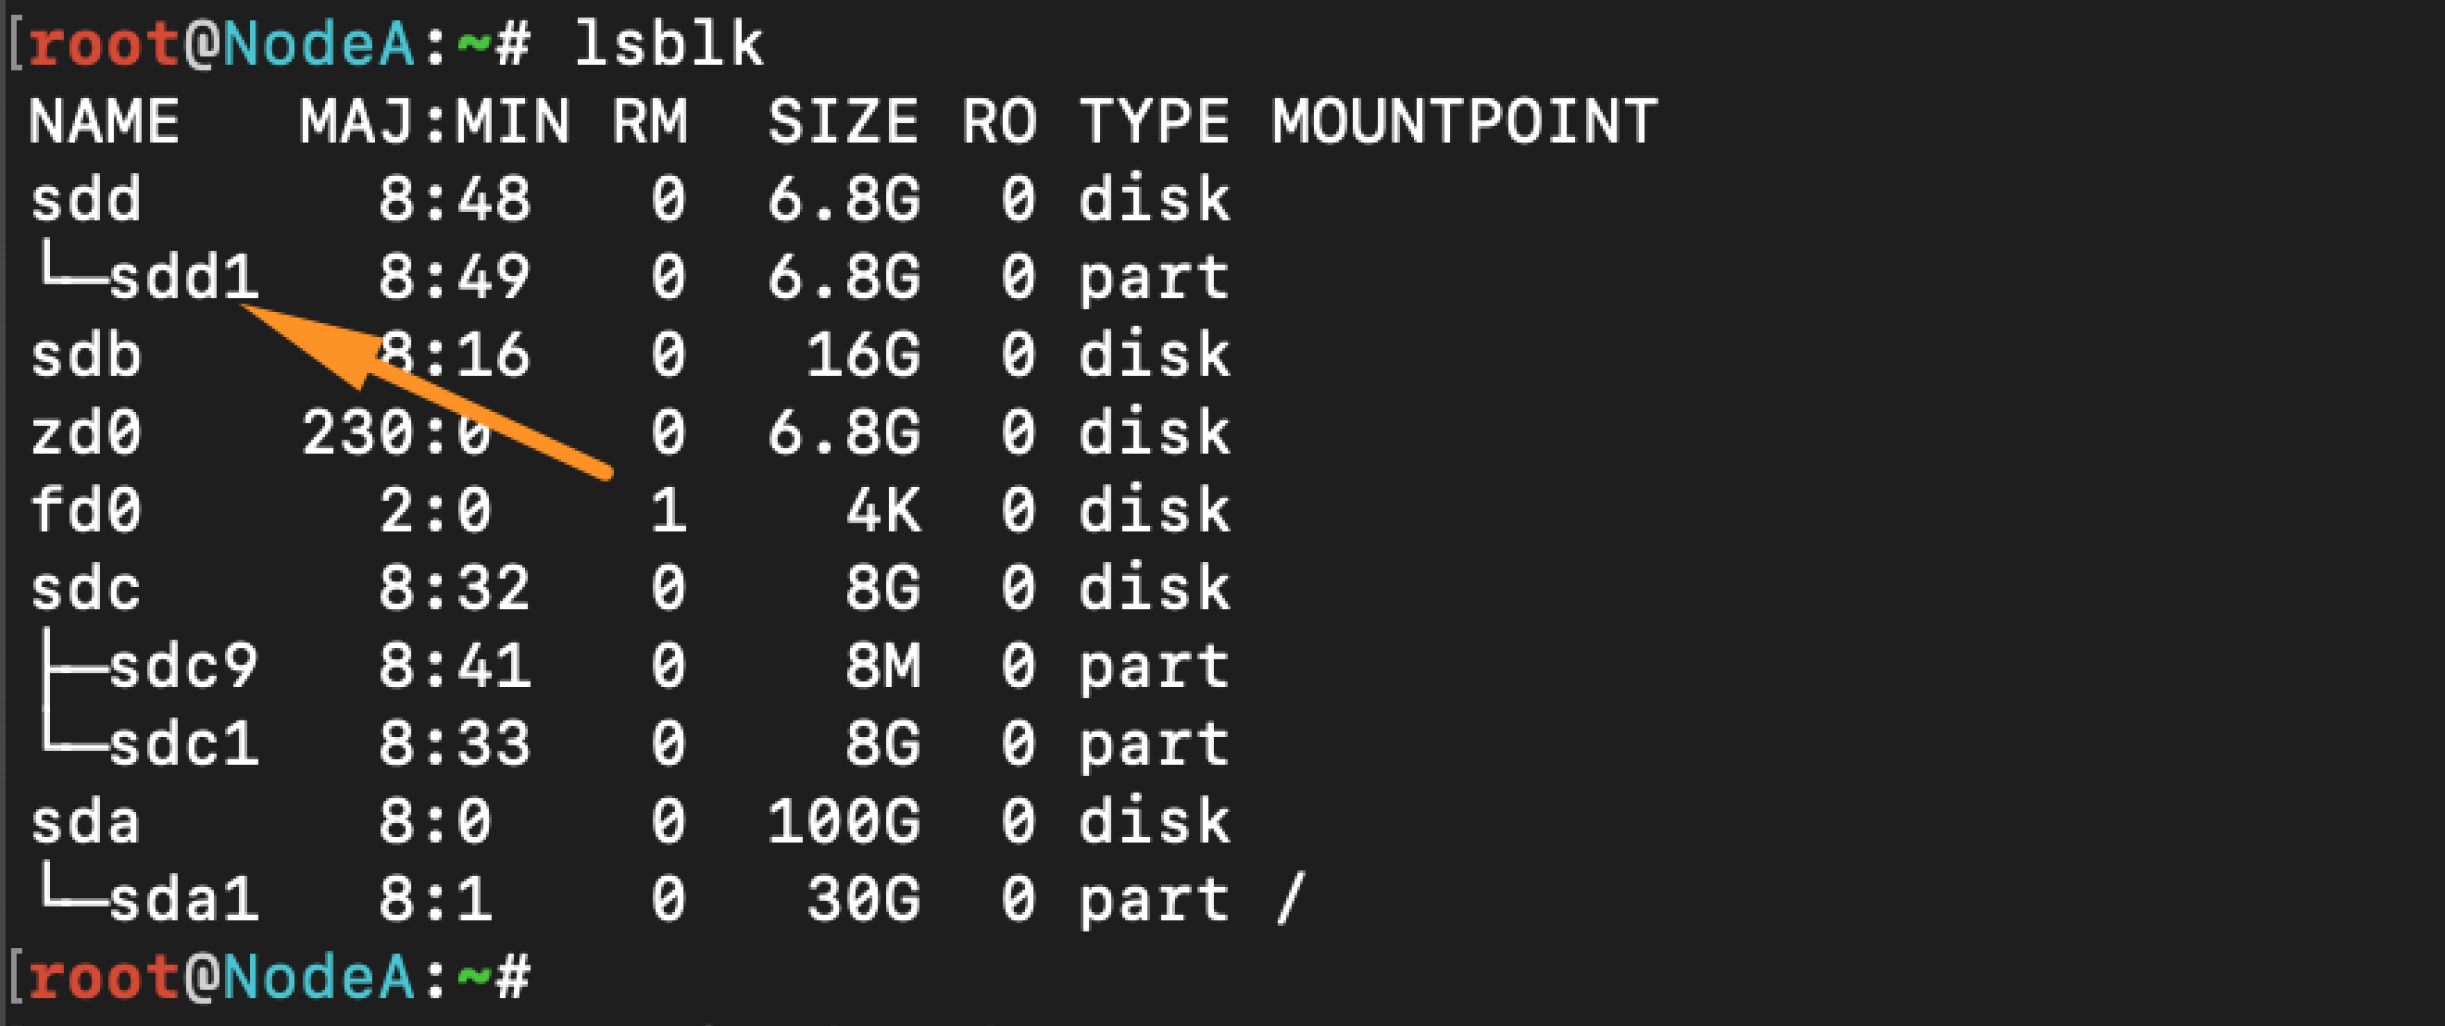
Now we can run lsblk to expose our new iSCSI disk on Node A. From the screenshot below, our new iSCSI disk is /dev/sdd1. You can run this command ahead of time to make sure that you take note of your current disk mappings before logging into the LUN. This will allow you to quickly identify the new disk after mounting. However, often times it is usually the first disk device from the output.

7. Mount NTFS Volume

Now we can mount our NTFS Volume to expose the data, but first, we’ll create a mount-point called /mnt/ntfs.

# mkdir /mnt/ntfs

# mount -t ntfs /dev/sdd1  /mnt/ntfs

The Configuration on Node A is complete!

8. rsync script Node A to Node B

On Node B let’s perform the steps # 5 to #7 but this time on Node B

Now we are ready to run our rsync script to copy our data over from Node A to Node B

9. Seeding data from Node A to Node B

We can run the command below on Node A to start seeding the data over from Node A to Node B

# rsync -Aavh /mnt/ntfs/* root@10.10.1.7:/mnt/ntfs

Once the copy is done, we’ll have the exact replica of our iSCSI data on Node B!

Crank Up the Performance for Your Cloud Applications

Crank Up the Performance for Your Cloud Applications

Cloud Storage Performance Overview

Users hate waiting for data from their Cloud application. As we move more applications to the Cloud, CPU, RAM, and fast networks are plentiful. However, storage rises to the top of the list for Cloud application bottlenecks. This blog gives recommendations to increase cloud storage performance for both managed storage services such as EFS and self-managed storage using a Cloud NAS. Trust Buurst’s SoftNAS for your cloud storage performance needs!

Here, you will find lots of performance statistics between AWS EFS and SoftNAS AWS NAS Storage.

Managed Service Cloud Storage

Many cloud architects turned to a managed cloud file service for cloud storage, such as AWS EFS, FSx, or Azure Files.

Amazon EFS uses the NFS protocol for Linux workloads.

FSx uses the CIFS protocol for Windows workloads.

Azure Files provides CIFS protocol for Windows.

None of these managed services provide iSCSI, FTP, or SFTP protocols.

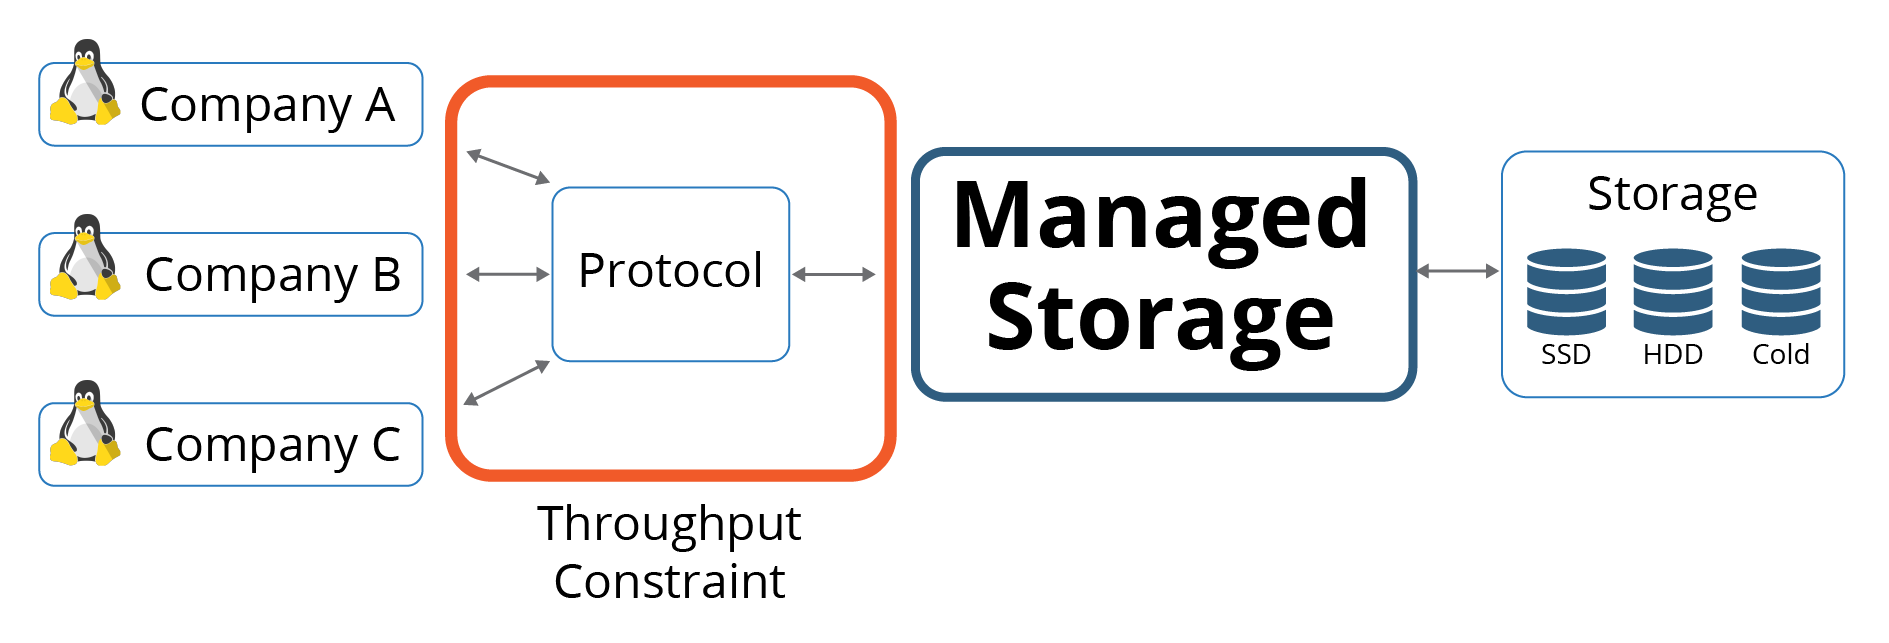
Throttled Bandwidth Slows Performance

Hundreds, even thousands of customers access storage through the same managed storage gateway. To prevent one company from using all the Throughput, managed storage services deliberately throttle bandwidth making performance inconsistent.

Buying More Capacity – Storing Dummy Data

To increase performance from a managed service file system, users must purchase additional storage capacity that they may not need or even use. Many companies store dummy data on the file shares to get more performance, therefore paying for more storage and achieving the performance needed for their application. Or, users can pay an additional premium price for provisioned Throughput or provisioned IOPS.


What Are You Paying For – More Capacity or Actual Performance?

AWS EFS Performance

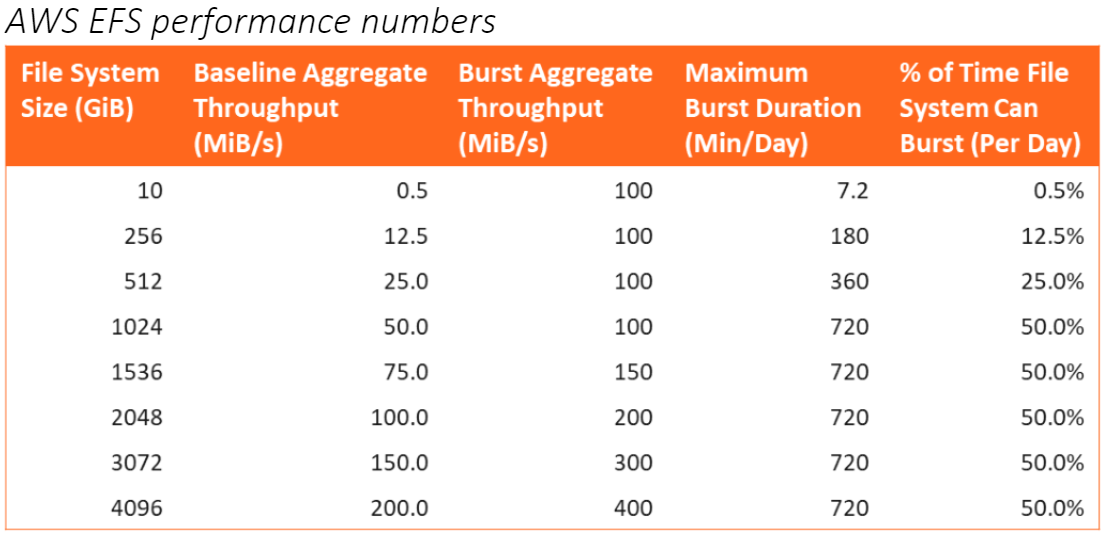
AWS provides a table that offers some guidance for the size of the File System and the Throughput users should expect. For solutions that require 100 MiB/s throughputs, that only have 1024 GiB storage, users will have to store and maintain 1024 GiB of useless data to achieve the published Throughput of 100 MiB/s. And because they were forced to overprovision, they are precluded from using Infrequent Access (IA) for the idle data that’s simply a “placeholder” to gain some AWS EFS performance.

With AWS EFS, users can pay extra for an increased throughput for $6.00 MB/s-Month, or $600 per 100 MB/s-Month.

Later in this paper, we will look at real-world performance benchmark data comparing AWS EFS to a cloud NAS.

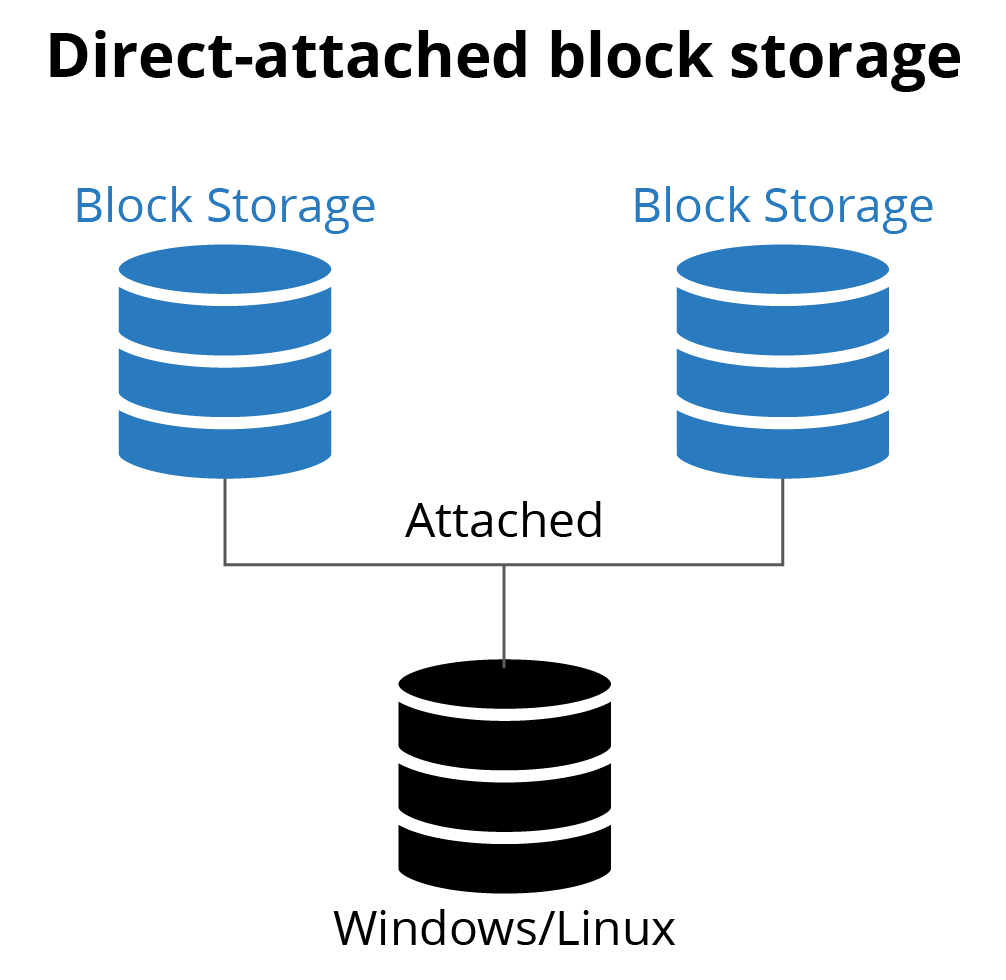
Direct-Attached Block Storage – Highest-performance cloud storage

The high performance cloud storage model is to attach block storage to the virtual server directly. This model connects block storage to each VM, but it is unable to be shared across multiple VMs.

Let’s Take a Trip Back to the 90’s

Direct-attached storage is how we commonly configured storage for the data center servers back in the ’90s. When you needed more storage, you turned the server off, opened the case, added hard disks, closed the case, and re-started the server. This cumbersome model could not meet any SLAs of 5-9s availability, so data centers everywhere turned to NAS and SAN solutions for disk management.

Trying to implement direct-attached storage for cloud-scale environments presents many of the same challenges of physical servers along with backup and restore, replication across availability zones, etc.

How a Cloud NAS Storage Improves Performance?

A cloud NAS or NAS Filer has direct connectivity to cloud block storage and provides a private connection to clients owned by your organization.

Four main levers used to tune the performance of cloud-based storage:

  1. Increase the compute: CPU, RAM, and Network speed of the cloud NAS instance.
    AWS and Azure virtual machines come with a wide variety of computing configurations. The more compute resources users allocate to their cloud NAS, the greater access they have to cache, Throughput, and IOPS.
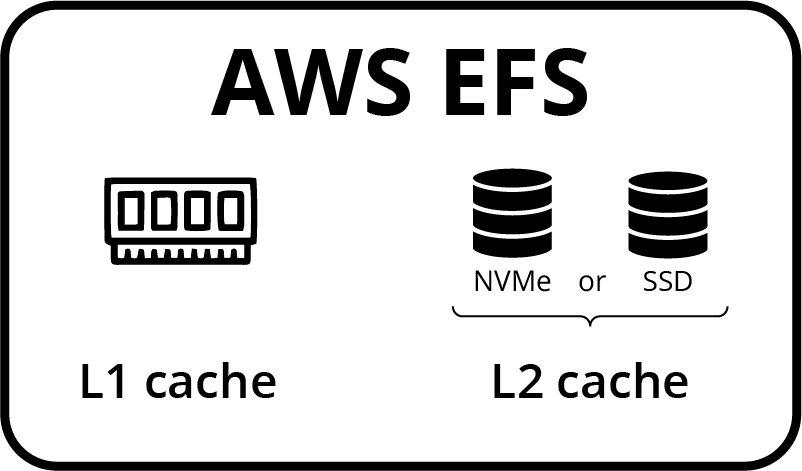
  2.  Utilize L1 and L2 cache.
    A cloud NAS would automatically use half of system RAM as an L1 cache. You can configure the NAS to use NMVE or SSD disk per storage pool for additional cache performance.
  3.  Use default client protocols.
    The default protocol for Linux is NFS, Windows default protocol is CIFS, and both operating systems can access storage through iSCSI. Although Windows can connect to storage with NFS, it is best to use default protocols, as Windows NFS is notoriously slow. With workloads such as SQL, iSCSI would be the preferred protocol for database storage.
  4.  Have a dedicated channel from the client to the NAS.
    A cloud NAS improves performance by having dedicated storage attached to the NAS and a dedicated connection to the client, coupled with dedicated cache and CPU to move data fast.


The caching of data is one of the most essential and proven technologies for improving cloud storage performance.

A cloud NAS has two types of cache to increase performance – L1 and L2 cache.

Level 1 (L1) Cache is an allocation of RAM dedicated to frequently accessed storage. Cloud NAS solutions can allocate 50% or more of system RAM for NAS cache.  For a NAS instance that has 128 GB of RAM, the cloud NAS will use 64 GB for file caching.

Level 2 (L2) Cache is NVME or SSD for larger capacity cache configured at the storage pool level.  NVMe can hold terabytes of commonly accessed storage, reducing access latency sub-millisecond in most cases.

Improve Cache for Managed Service

Managed services for storage may have a cache of frequently used files. However, the managed service is providing data for thousands of customers, so the chances of obtaining data from the cache are low. Instead, you can increase the cache side of each client. It is recommended by AWS to increase the size of the read and write buffers for your NFS client to 1MB when you mount your file system.

Improve Cache for Cloud NAS

Cloud NAS makes use of the L1 and L2 cache for your NAS VM. RAM for cloud virtual machines ranges from 0.5 MB to 120 GB. SoftNAS Cloud NAS uses half of the RAM for L1 cache.

For L2 cache, SoftNAS can dedicate NVMe or SSD to an individual or tiering volume. For some applications, an SSD L2 cache may provide an acceptable level of performance, for the highest level of performance, a combination of L1 (Ram) AND L2 cache will deliver the best performance price.

Cloud storage performance is governed by a combination of Protocols, Throughput and IOPs.

Choosing Native Client Protocols Will Increase Cloud Storage Performance.

Your datacenter NAS supports multiple client protocols to connect storage to clients such as Linux and Windows. As you migrate more workloads to the cloud, choosing a client protocol between your client and storage that is native to the storage server operating system (Linux or Windows) will increase the overall performance of your solution.

Linux native protocols include iSCSI, Network File System (NFS), FTP, and SFTP.

Windows native protocols are iSCSI and Common Internet File System (CIFS), which is a dialect of Server Message Block (SMB). Although Windows with POSIX can run NFS, it’s not native to Windows, and in many cases, you will have better performance running native protocol CIFS/SMB instead of NFS on Windows.


The following chart shows how these protocols compare across AWS and Azure today.
SoftNASAWS EFSAWS FSxAzure files
NFSsupportedsupported
CIFSsupportedsupportedsupported
FTPsupported
SFTPsupported

For block-level data transport, iSCSI will deliver the best overall performance.

iSCSI is one of the more popular communications protocols in use today and is native in both Windows and Linux. For Windows, iSCSI also provides the advantage of looking like a local disk drive for applications that require the use of local drive letters, e.g., SQL Server snapshots and HA clustered shared volumes.

Throughput

Throughput is the measurement of how fast (per second) your storage can read/write data, typically measured in MB/sec or GB/sec. You may have seen this number before when looking at cloud-based hard drive (HDD) or solid-state disk (SSD) specifications.

Improve Throughput for Managed Service

For managed cloud file services, Throughput is the amount of storage you purchase. Throughput varies from 0.5 to 400 MBs. To prevent one customer from overuse the access to a pool of disks, Azure and AWS throttles access to storage. They both also allow for short bursting to the disk set and will charge for over bursting.

Improve Throughput for Cloud NAS

For a cloud NAS, Throughput is determined by the size of the NAS virtual machine, the network, and disk speeds. AWS and Azure allocate more Throughput on VM images that have access to more RAM and CPU. Since the NAS is dedicated to the owner of the NAS, the storage is directly attached to the NAS; there is no need to throttle or burst limit throughput to the clients. That is, Cloud NAS provides continuous, sustained Throughput all the time for predictable performance.

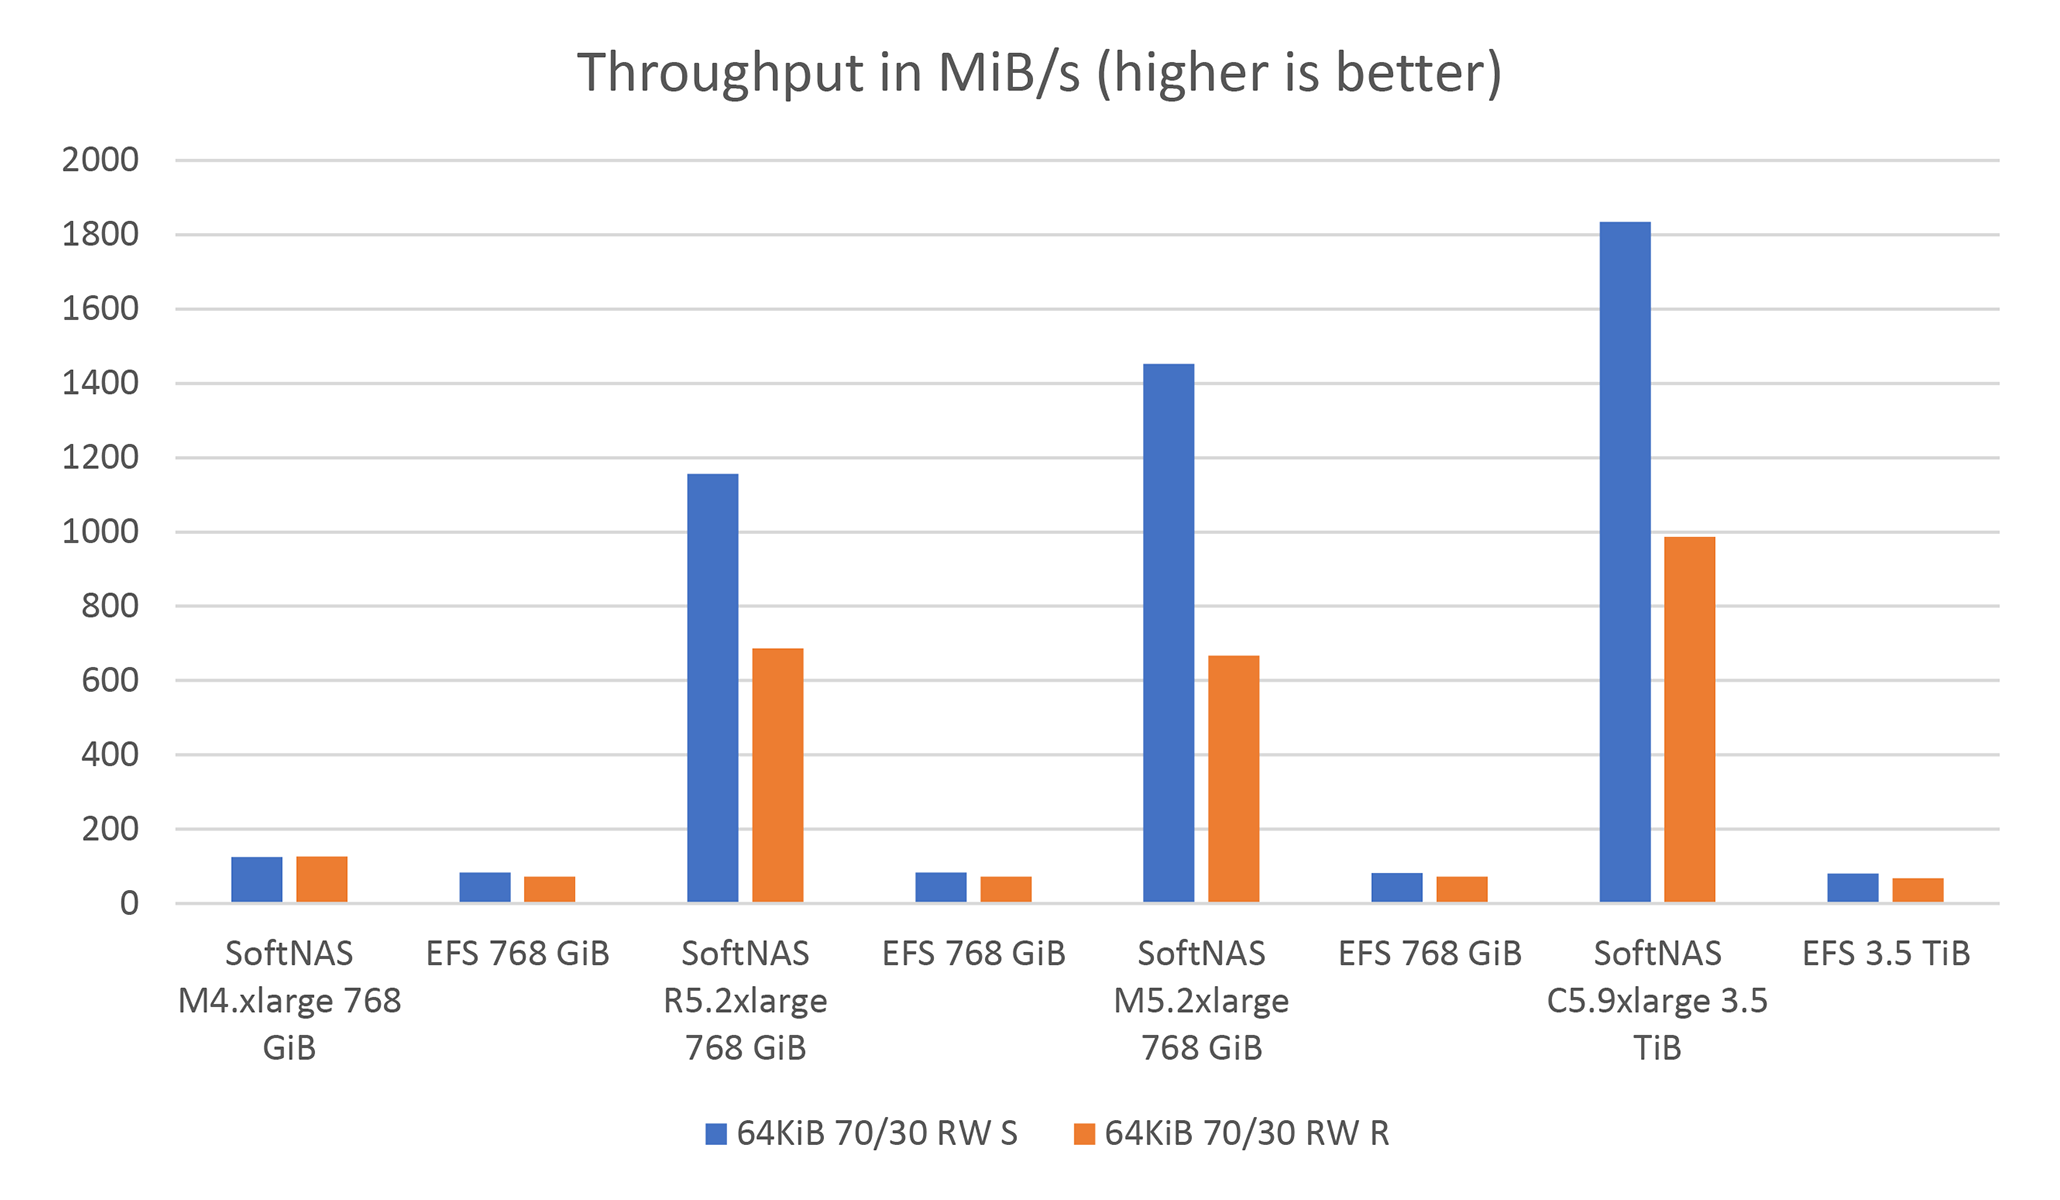
Comparing Throughput MiB/s

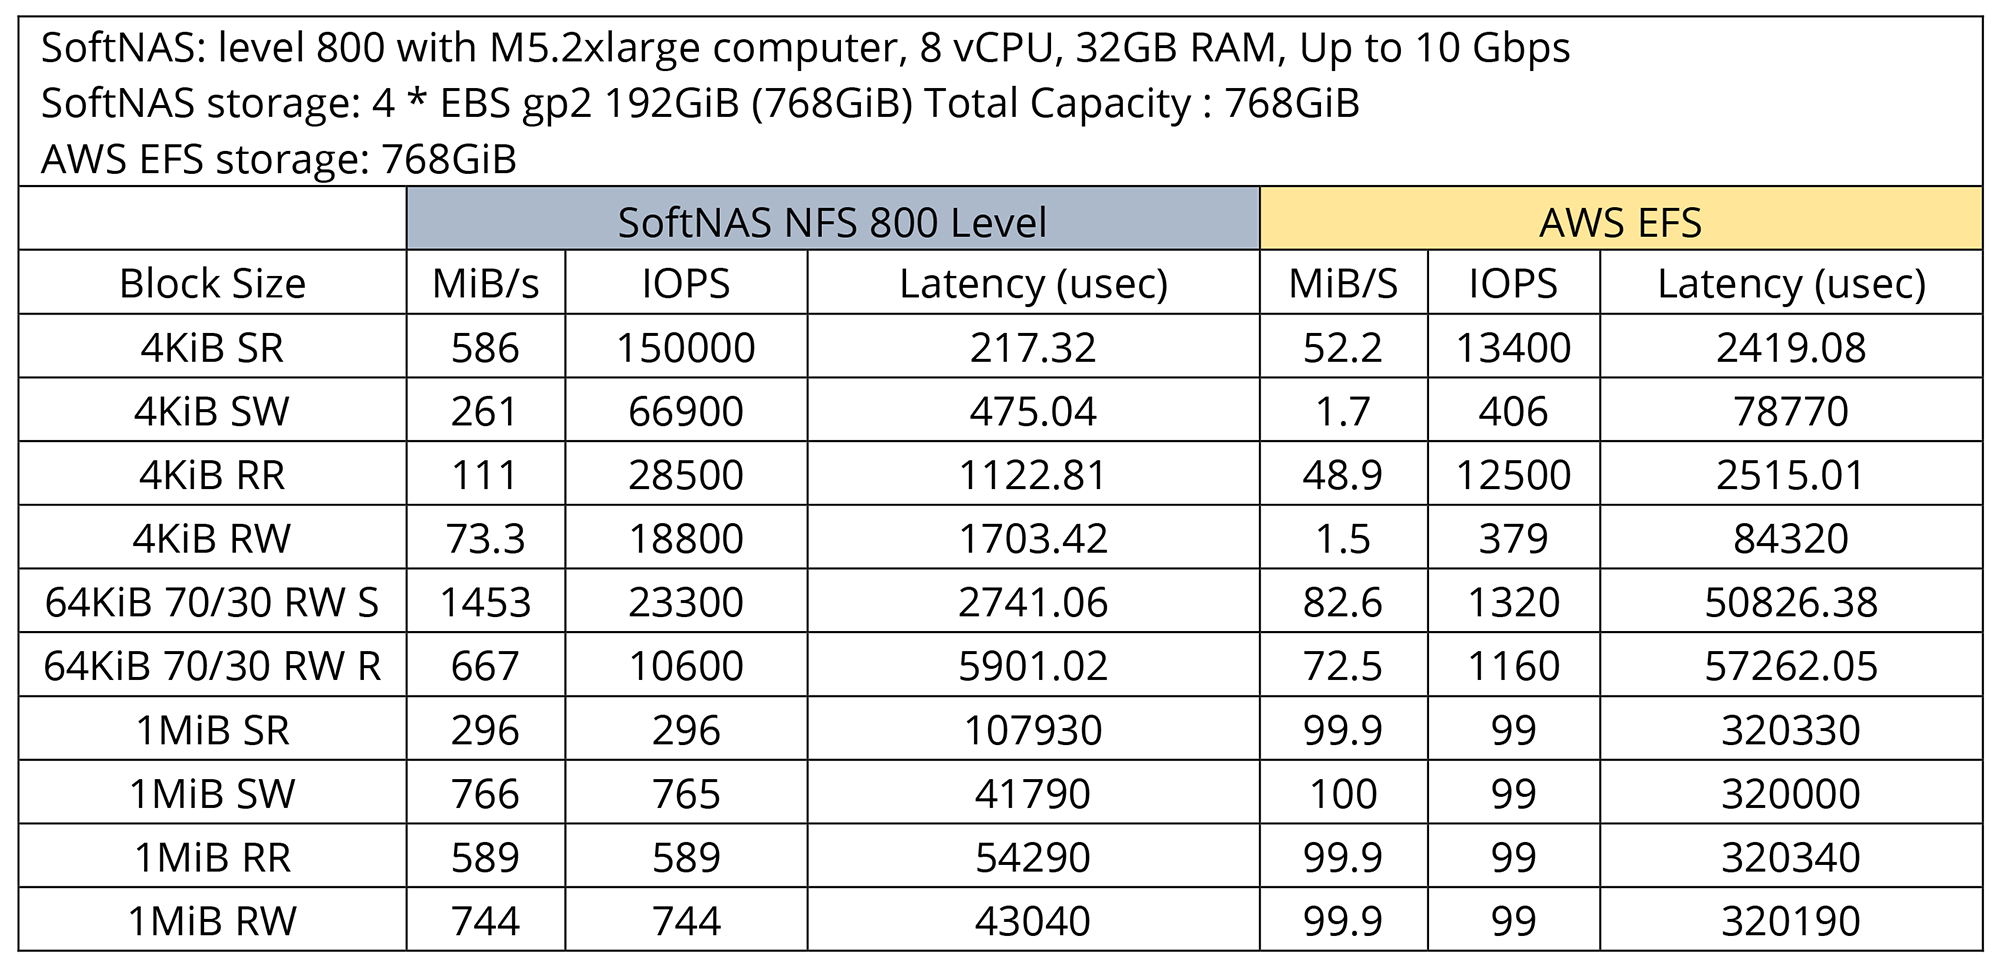
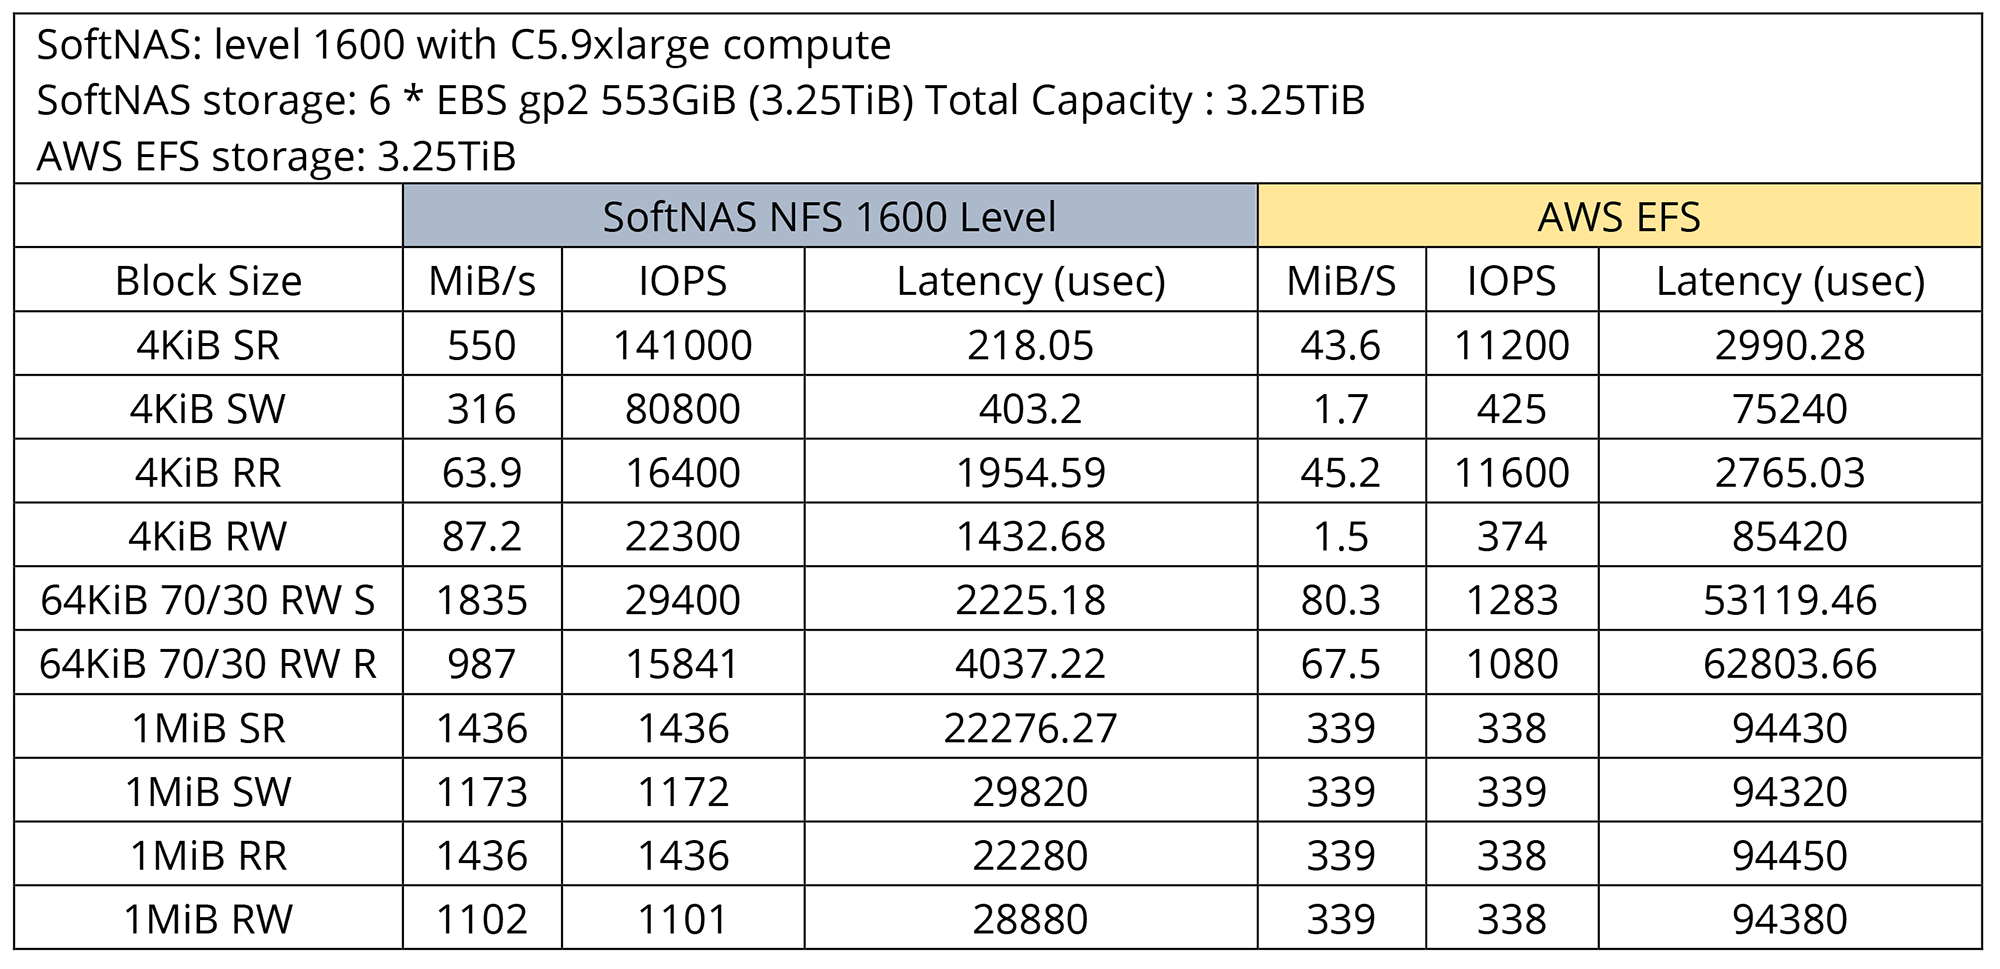
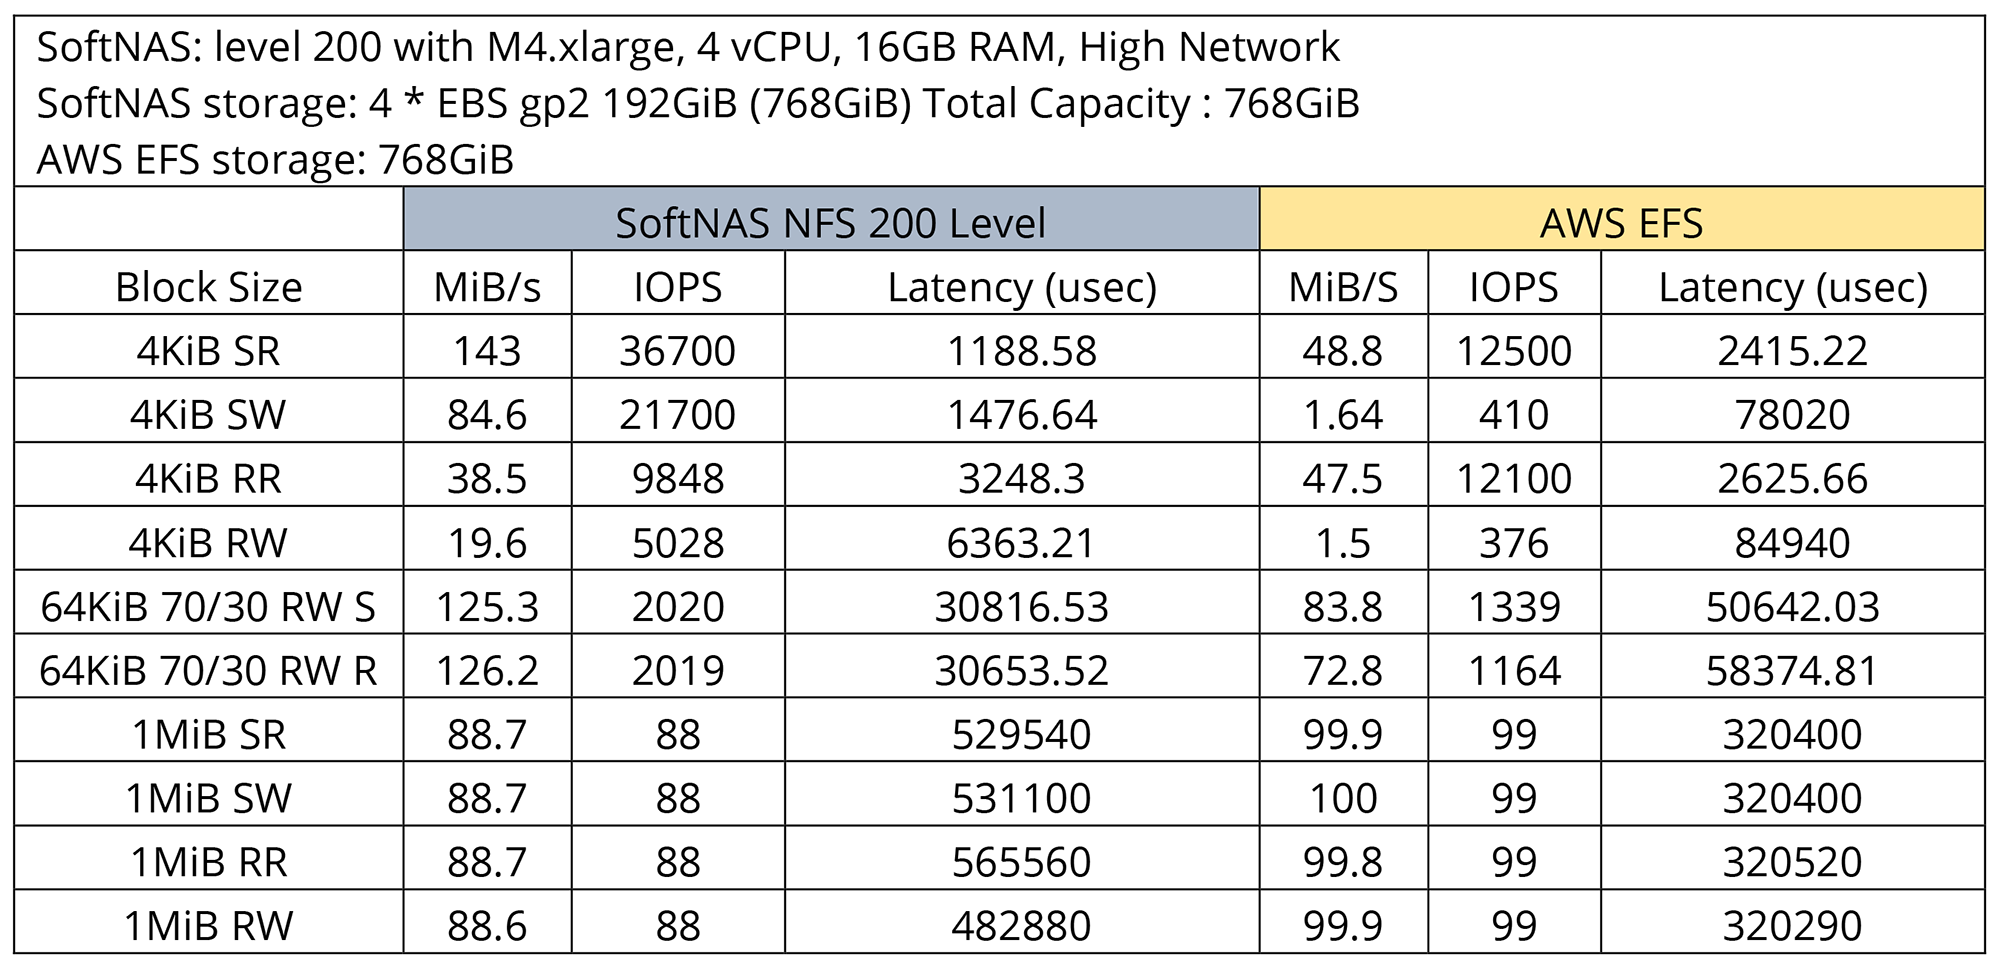
A Linux FIO server was used to perform a throughput evaluation of SoftNAS vs EFS. With a cloud storage capacity of 768 GiB, 3.5 TiB, and a test configuration of 64KiB, 70% read and 30% write, the SoftNAS was able to out perform AWS EFS MiB/s in both sequential and random read/writes.

IOPs

IOPs are Input/output operations per second and is used as a performance measurement to characterize storage performance. Disks such as NVMe, SSD, HDD, and cold storage vary in IOPS. The higher the IOPS, the faster you have access to the data stored on the disk.

Improve IOPS for Managed Cloud File Storage

There is no configuration to increase the IOPS of a managed cloud file store.

Improve IOPS for Cloud NAS

To improve IOPS on a cloud NAS, you increase the amount of CPU’s which increase the available RAM and network speed and you can add more disk I/O devices as an array to aggregate each disk’s IOPS to as high as 1 million IOPS with NVMe over 100 Gbps networking, for example.

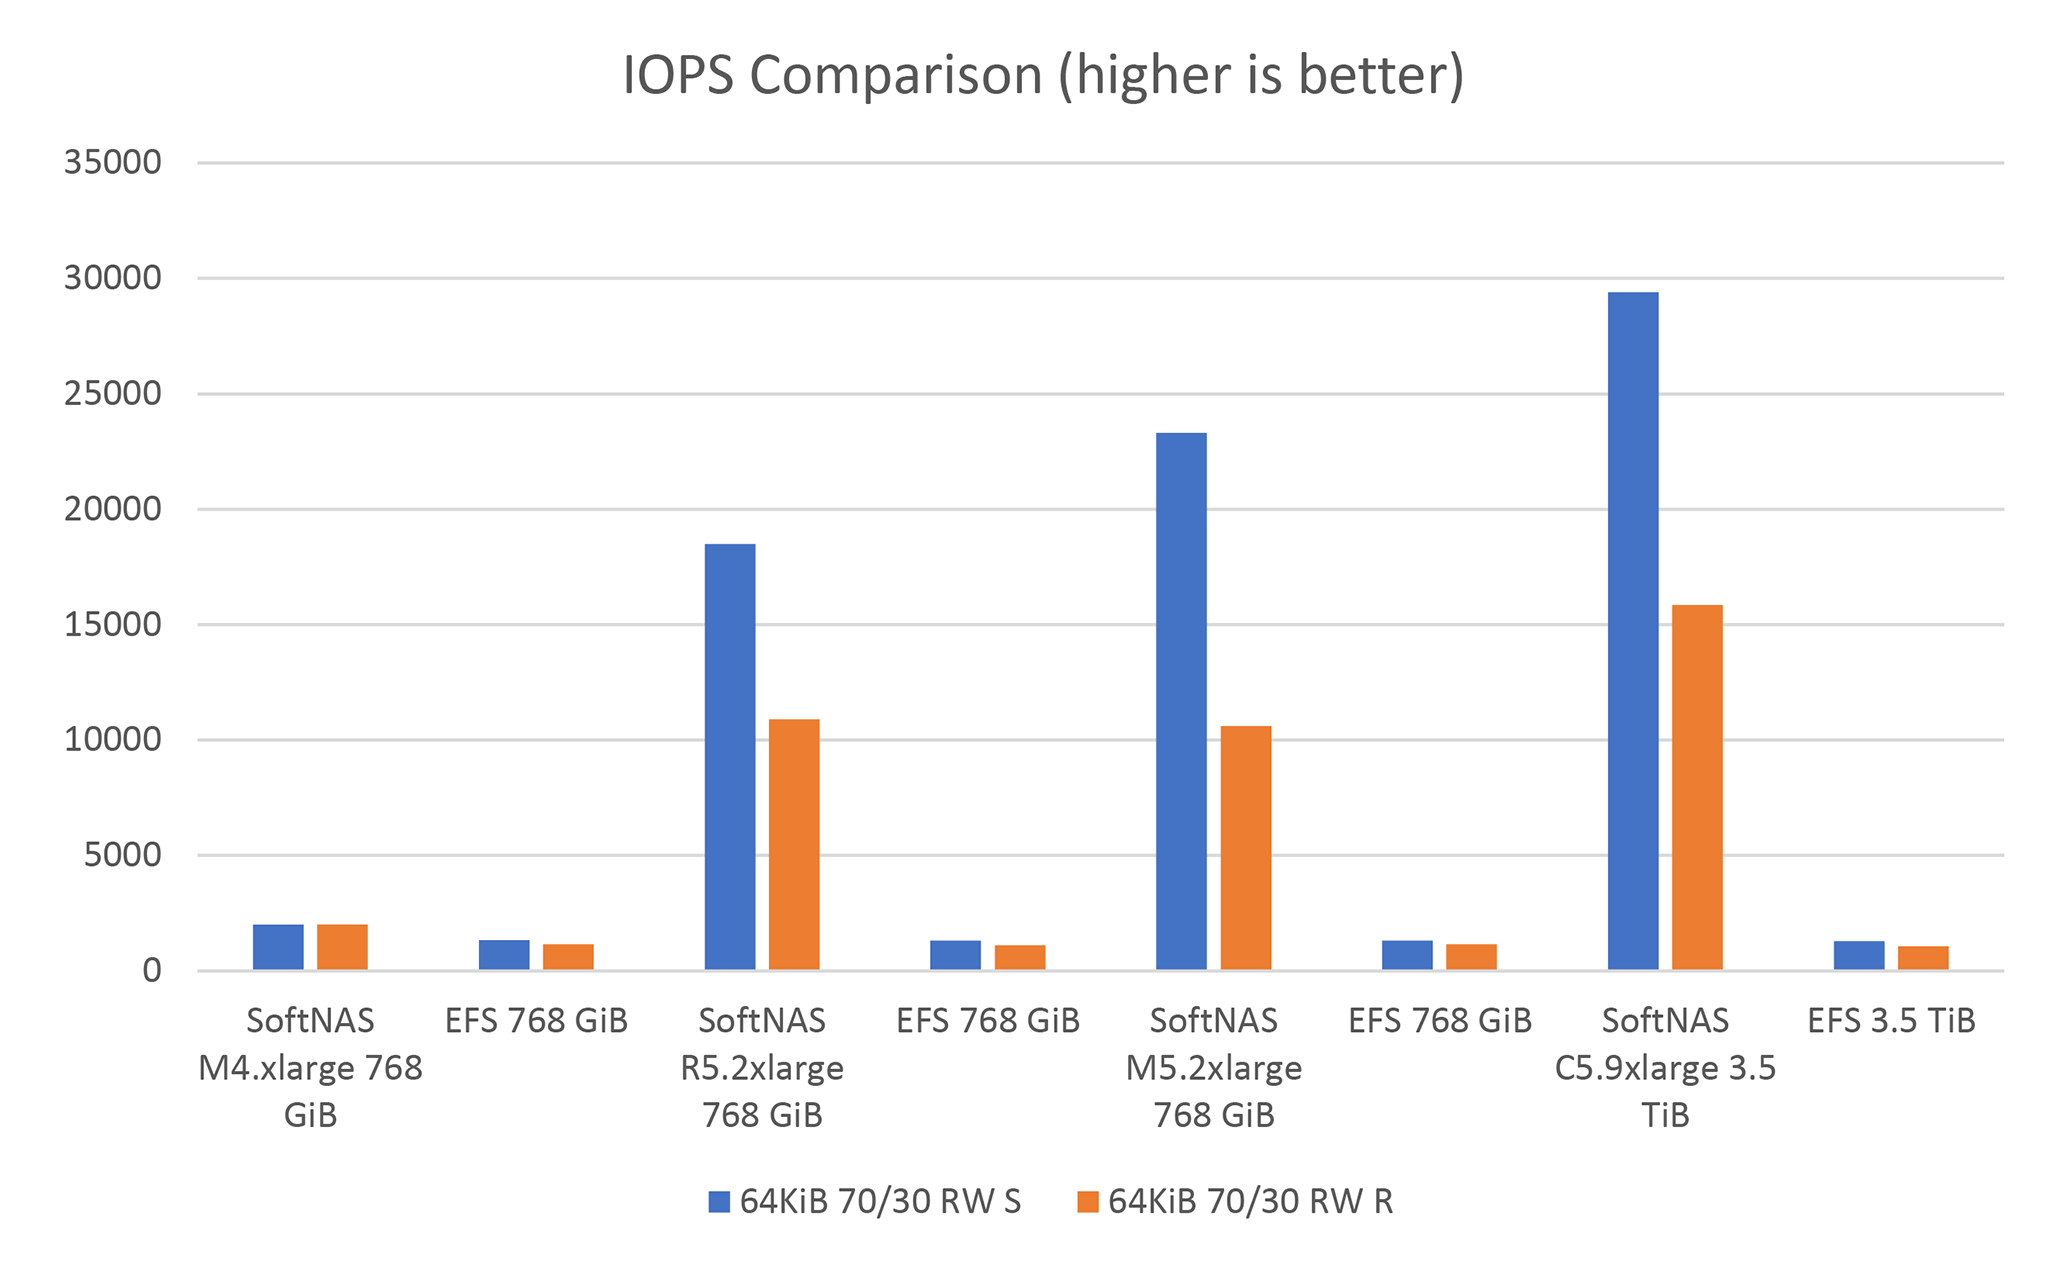
Comparing Throughput IOPS

A Linux FIO server was used to perform an IOPS evaluation of SoftNAS vs EFS. With a cloud storage capacity of 768 GiB, 3.5 TiB, and a test configuration of 64KiB, 70% read and 30% write, the SoftNAS was able to out perform AWS EFS IOPS in both sequential and random read/writes.

How Buurst Shattered the 1 Million IOPs Barrier

NVMe (non-volatile memory express) technology is now available as a service in the AWS cloud with certain EC2 instance types. Coupled with 100 Gbps networking, NVME SSDs open new frontiers of HPC and transactional workloads to run in the cloud. And because it’s available “as a service,” powerful HPC storage and compute clusters can be spun up on-demand, without the capital investments, time delays, and long-term commitments usually associated with High-Performance Computing (HPC) on-premises.

This solution leverages the Elastic Fabric Adapter (EFA), and AWS clustered placement groups with i3en family instances and 100 Gbps networking. SoftNAS Labs testing measured up to 15 GB/second random read and 12.2 GB/second random write throughput. We also observed more than 1 million read IOPS and 876,000 write IOPS from a Linux client, all running FIO benchmarks.

Latency

Latency is a measure of the time required for a sub-system or a component in that sub-system to process a single storage transaction or data request. For storage sub-systems, latency refers to how long it takes for a single data request to be received and the right data found and accessed from the storage media. In a disk drive, read latency is the time required for the controller to find the proper data blocks and place the heads over those blocks (including the time needed to spin the disk platters) to begin the transfer process.

In a flash device, read latency includes the time to navigate through the various network connectivity (fibre, iSCSI, SCSI, PCIe Bus and now Memory Bus). Once that navigation is done, latency also includes the time within the flash sub-system to find the required data blocks and prepare to transfer data. For write operations on a flash device in a “steady-state” condition, latency can also include the time consumed by the flash controller to do overhead activities such as block erase, copy and ‘garbage collection’ in preparation for accepting new data. This is why flash write latency is typically greater than read latency.

Improve latency for Managed Cloud File Storage

There is no configuration to decrease the IOPS of a managed cloud file store

Improve Latency for Cloud NAS

Latency improves as the network, cache and CPU increases for the Cloud NAS

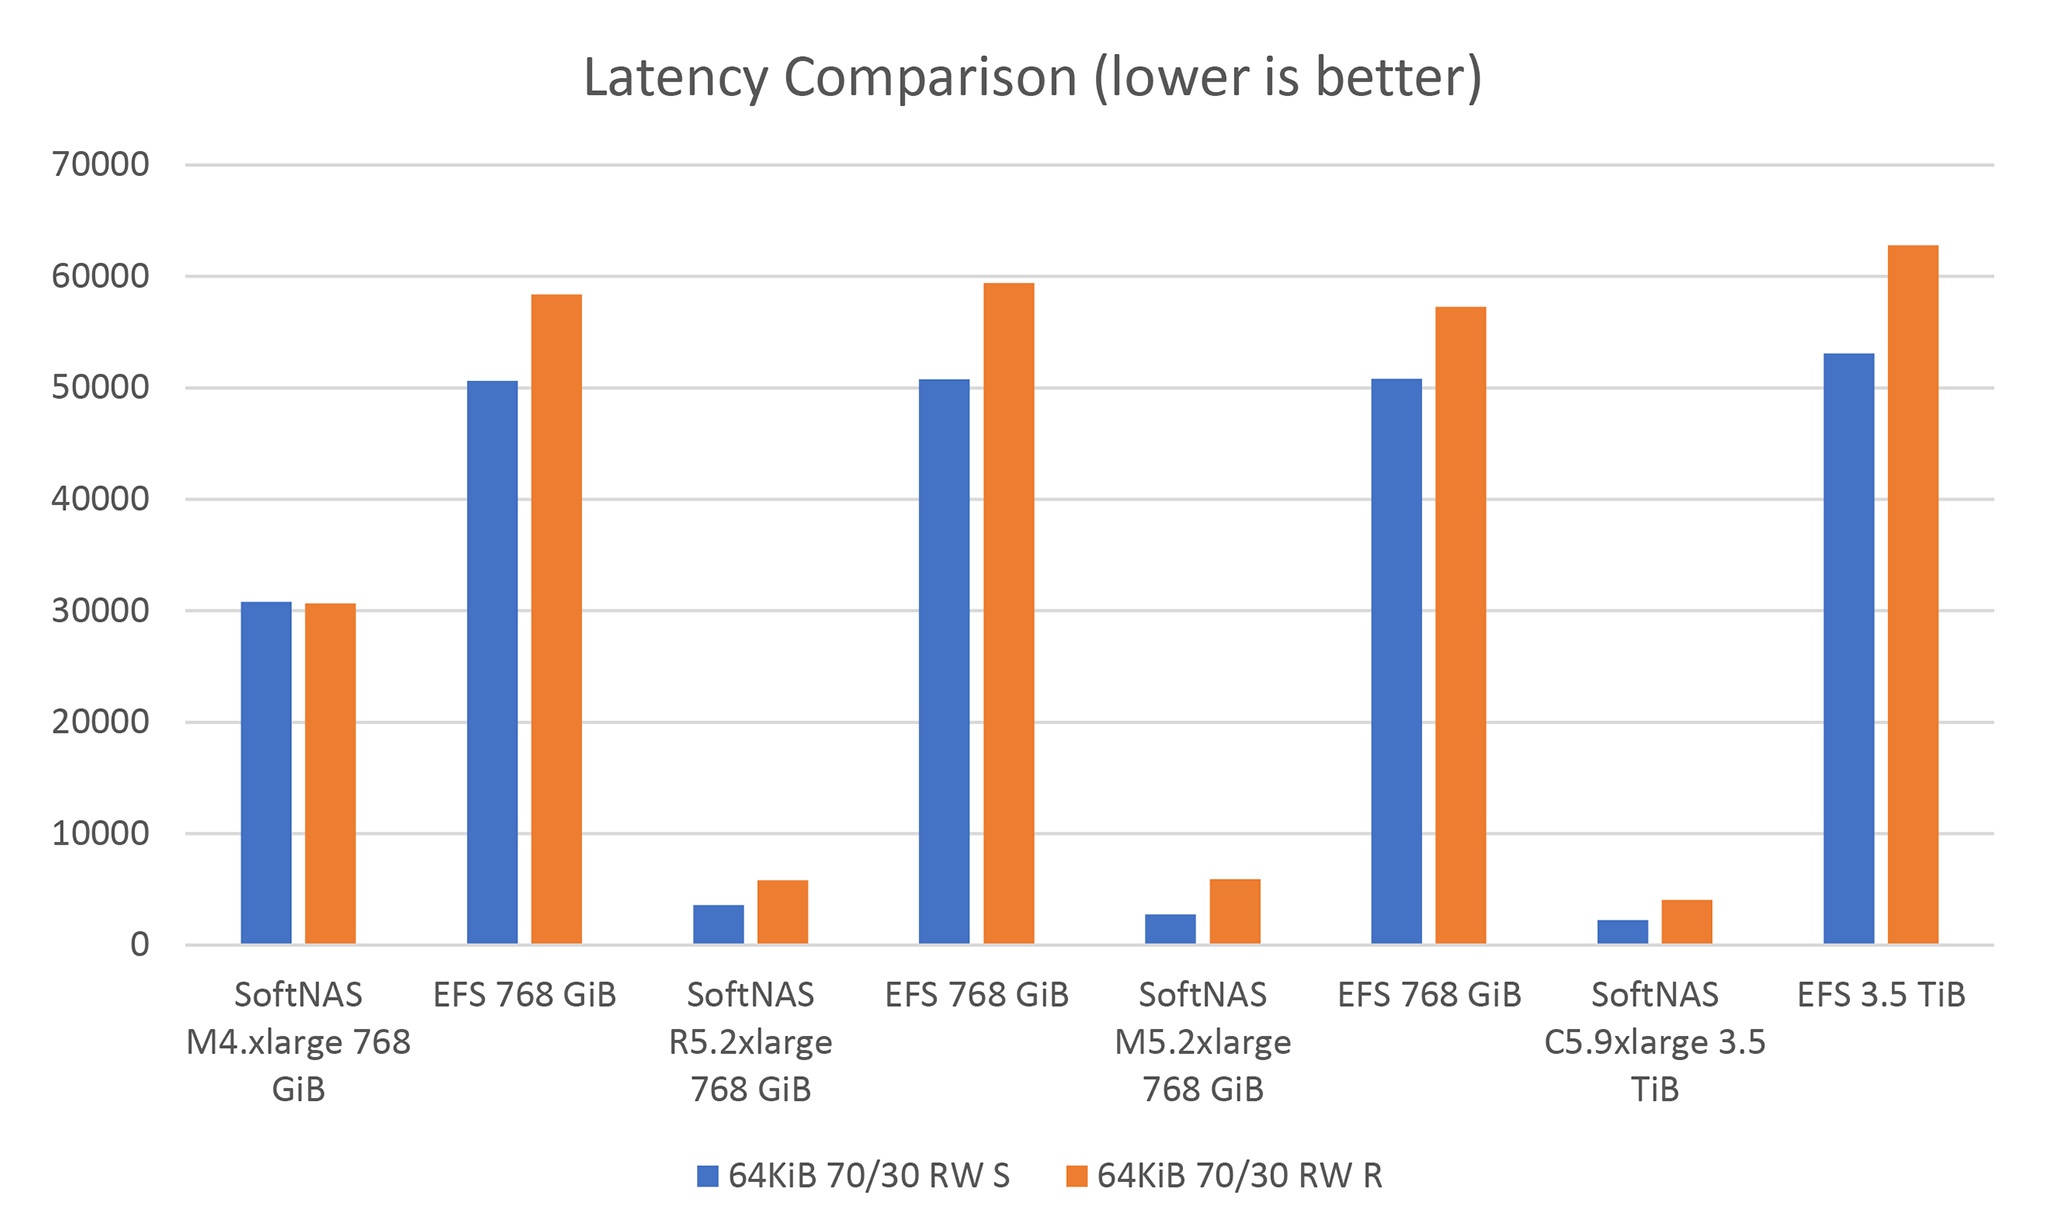
Comparing Latency

A Linux FIO server was used to perform a latency evaluation of SoftNAS vs EFS. With a cloud storage capacity of 768 GiB, 3.5 TiB, and a test configuration of 64KiB, 70% read and 30% write, the SoftNAS was able to out perform AWS EFS latency in both sequential and random read/writes.

Testing SoftNAS Cloud NAS to AWS EFS Performance

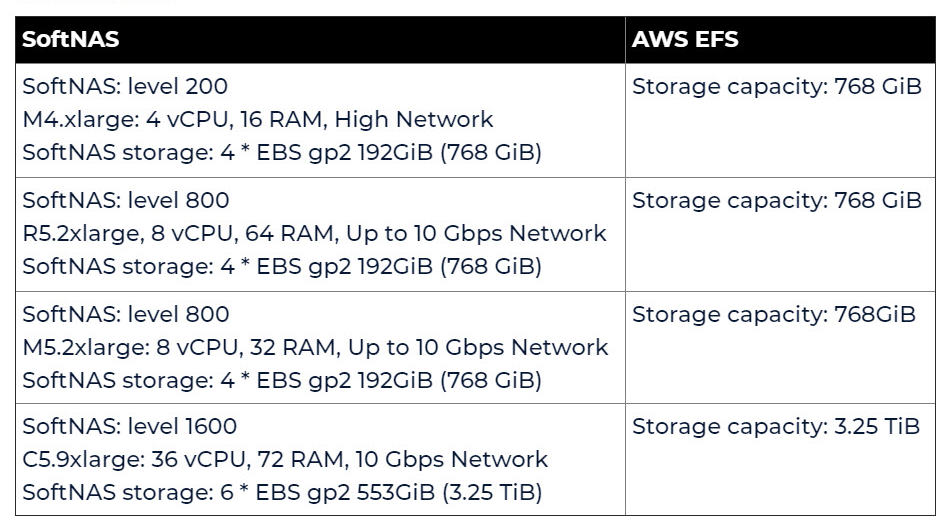
For our testing scenario we used a Linux FIO server with 4 Linux clinets running RHEL 8.1 running FIO Client. NFS was used to connect the clients to EFS and SoftNAS. The SoftNAS version was Version 4.4.3. AWS increases performance as storage increases, in order to create an apples to apples compairison, we used AWS published performance numbers as a baseline for the instance of the NAS. For instance, the SoftNAS level 200 – 800 tests used 768 GiB of storage where the SoftNAS 1600 test used 3.25 TiB.

Head to Head

Environment Description

Testing Methodology –  SoftNAS Configuration.

The backend storage geometry is configured in such a way that the instance size, not the storage, is the bottleneck while driving 64KiB.

For example: M5.2xlarge (400 level) has a limit storage throughout limit of 566MiB/s. At 64KiB I/O we need to drive 9,056 IOPS to achieve this throughput at 64KiB request sizes.

AWS EBS disks provide 16,000 IOPS and 250 MiB/s throughput.

In this case a pool was created with 4 192GiB EBS volumes for a theoretical throughput of 1,000MiB/s and IOPs of 64,000: No bottleneck.

AWS EFS Configuration

AWS EFS performance scales based on used capacity. In order to provide the closest comparison, the EFS volume was pre-populated with data to consume the same amount of storage as the SoftNAS configuration.

SoftNAS capacity: 768 GiB (4 X 192 GiB)

AWS EFS : 768 GB of data added prior to running the test.

SoftNAS storage geometry was configured to provide sufficient IOPs at 64KiB I/O request sizes in order to exceed the throughput limit of the backend storage.

For example, to achieve the maximum allowed storage throughput for a VM limited to 96 MiB/s at 64KiB IO sizes we must be able to drive 1,536 IOPs.

Test Parameters

Ramp up time : 15 minutes

  • This allows time for client side and server-side caches to fill up avoiding inflated results while initial cache is used/ filled

Run time 15minutes

  • The length of time performance measurements are recorded during the test

Test file size: 2 X system memory

  • Ensures that the server-side IO is not running in memory; writes and reads are to the backend storage

Idle : 15 minutes

  • An idle time is inserted between each run ensuring the previous test has completed it’s I/O operations and will not contaminate other results.

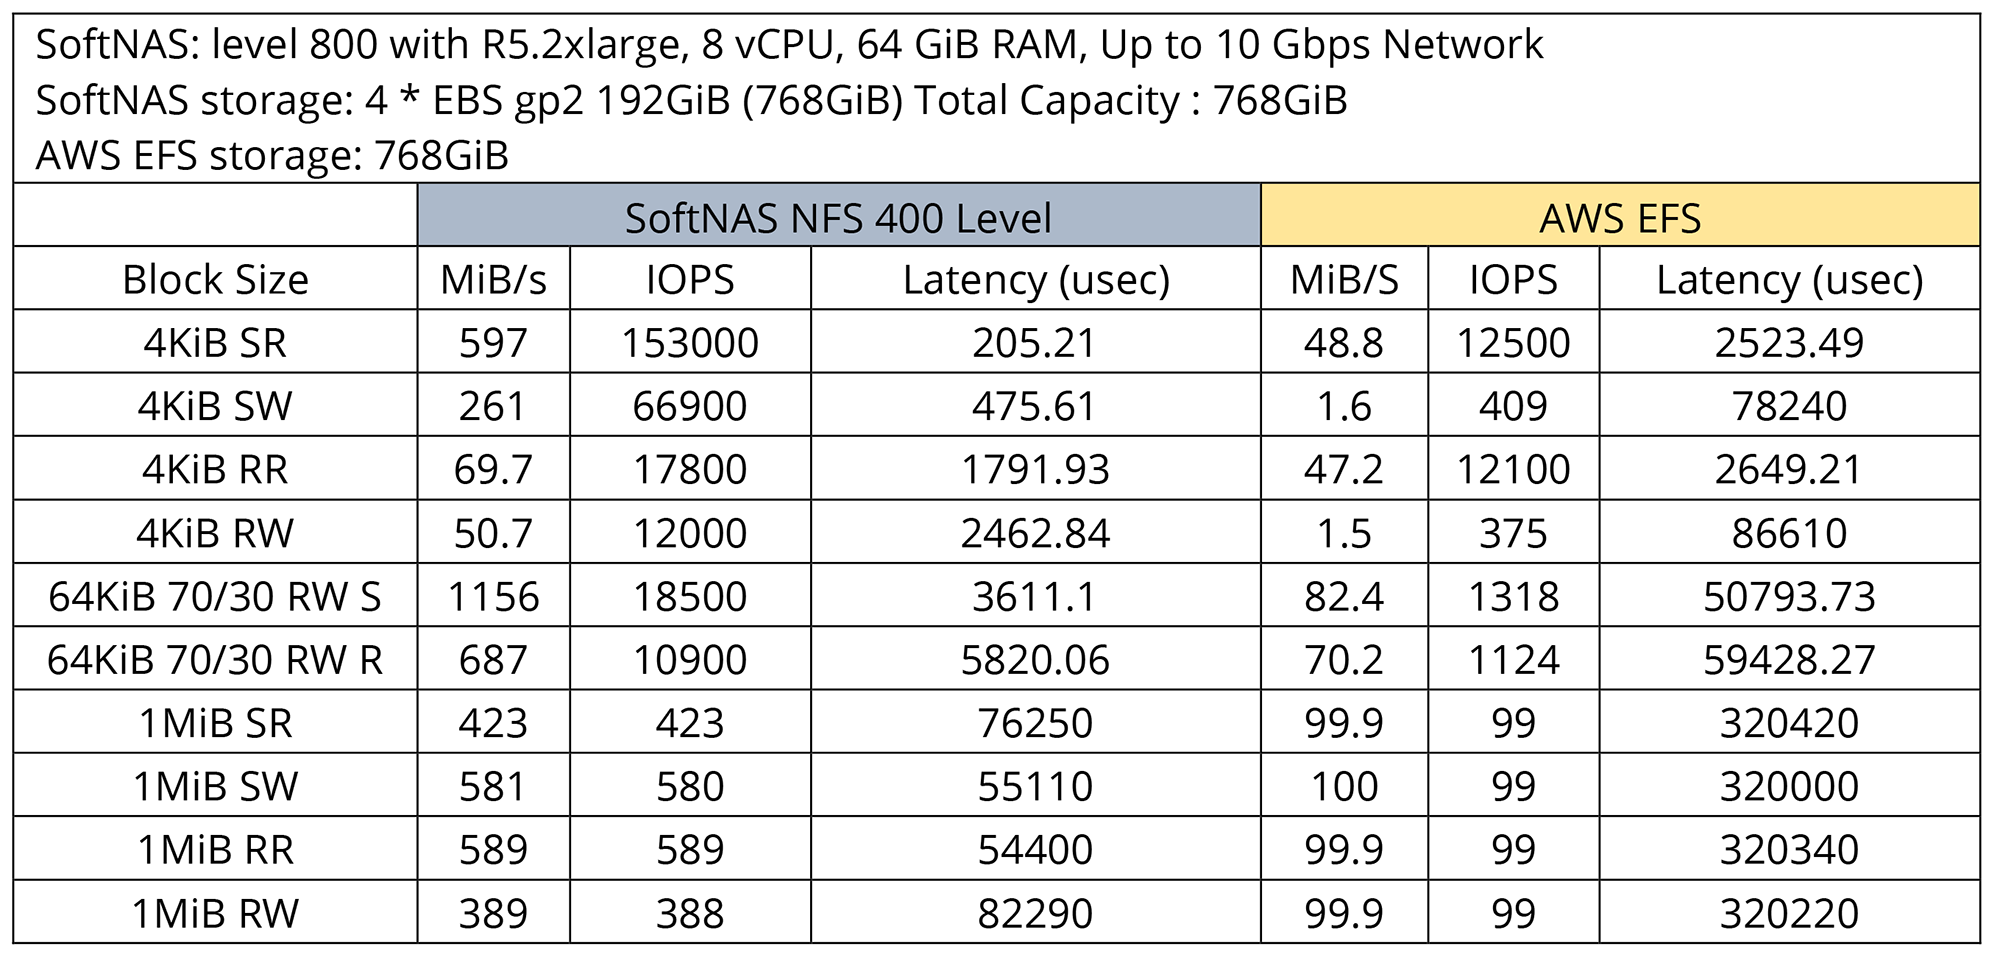
Results

Using a Cloud NAS to improve your VDI experience

Using a Cloud NAS to improve your VDI experience

Virtual Desktop Infrastructure performance

Move cloud desktops closer to LOB applications and data.

Today, many organizations are supporting cloudbased virtual desktops more than ever before. But users will still resist cloud desktops if the experience is not equal to or better than they have now. The best way to increase the performance and usability of a cloud desktop is to move all application servers out of the data center and closer to the cloud desktop.
VDI

Cloud desktops next to business apps and data

Cloud desktops can deliver the best user experience, increase productivity, and satisfaction if you migrated LOB applications running next to the cloud desktop lowers latency and increased speedUsers get better than PC performance because they are accessing data centerclass hardware. Users will have nform factor limitations. On-prem application traffic flows through highperformance Azure backboneTeams, O365, etc. run on the same high-performance Azure backbone as your desktopsNo data flows through virtual desktop (better for security and performance). And LOB web applications run at full speed next to the desktop. 
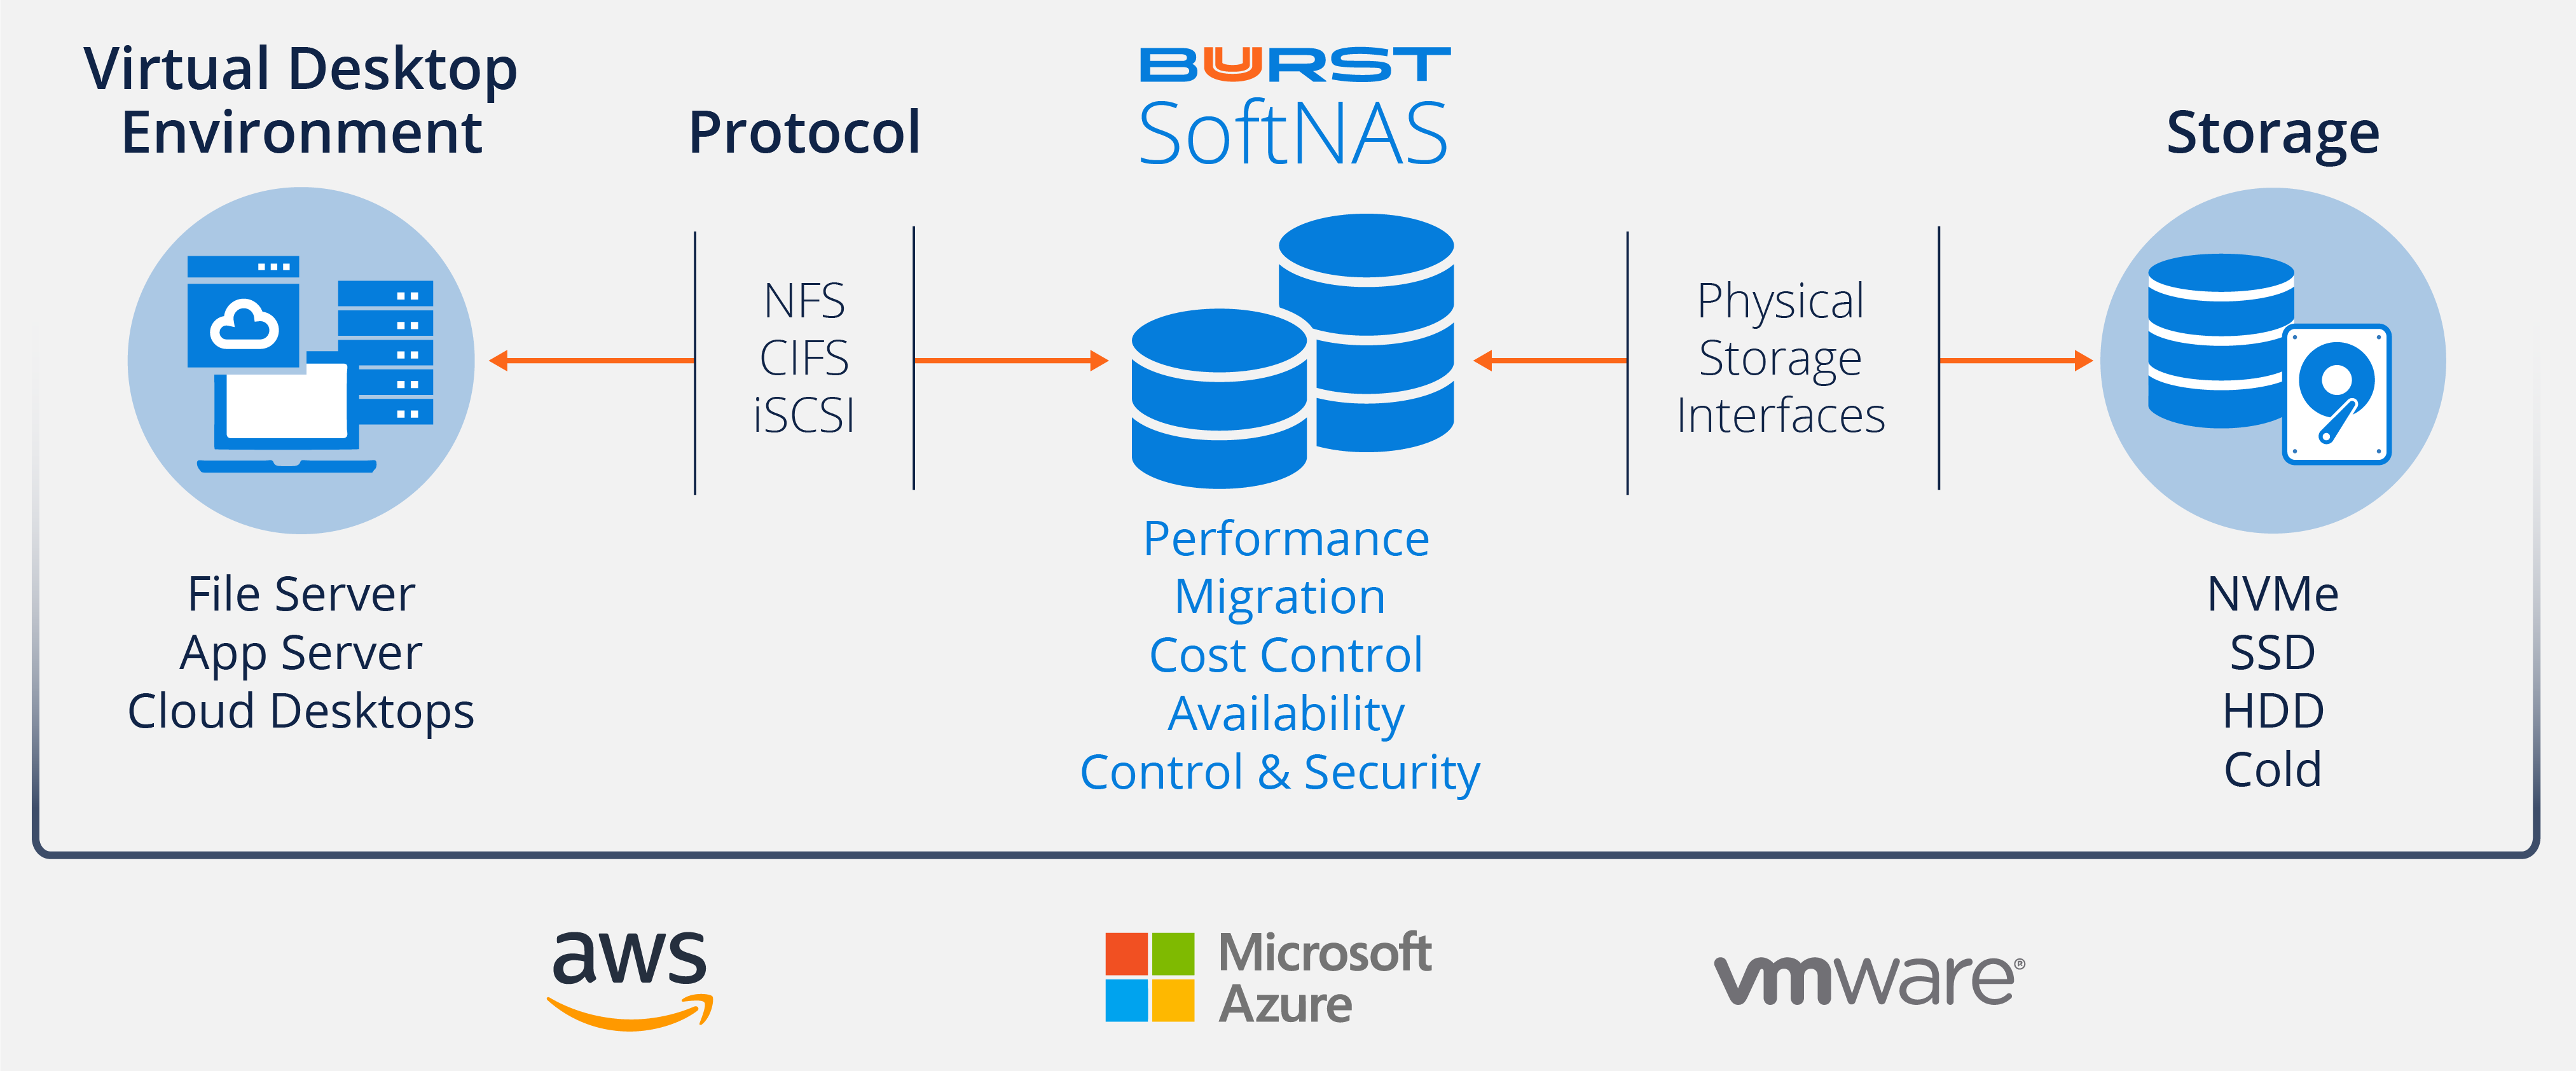
User Satisfaction

Cloud desktop users expect on-premises performance. To deliver a complete cloud desktop experience, you need to reduce bottlenecks at the desktop, business applications, and storage. Cloud desktop, LOB cloud applications, Web applications all run at full speed with low latency, increasing satisfaction 
Reduce cost

  • SoftNAS utilizes storage options: Block storage comes in SSD, HDD, and cold storage, SoftNAS manages the storage layer to make it highly available and fast at the lowest cost.

  • SoftNAS offers inline deduplication of data files are compared block by block for redundancies, which then are eliminated, and, in most cases, data is reduced by 50 – 80%. 

  • SoftNAS has data compression to reduces the number of bits needed to represent the data. It’s a simple process and can lower storage costs by 50-75%. 

  • SoftNAS SmartTiers™ moves aging data from expensive, high-performance block storage to less expensive block storage, reducing storage costs by up to 67% 

  • SoftNAS offers the lowest price per GB for cloud storage.

Check Also:

SoftNAS to improve your VDI performance


Click below for a VDI and LOB application demo

That’s not the throughput I was expecting

That’s not the throughput I was expecting

“That’s not the throughput I was expecting.”

I have heard that multiple times throughout my career, more so now that workloads are being transitioned into the cloud. In most cases it comes down to not understanding the relationship between IOPs (I/Os per second)I/O request size and throughput. Add to that the limitations imposed on cloud resources, not only the virtual machine, but the storage side as well and you have two potential bottlenecks. 

For example, suppose an app has a requirement to sustain 200 MB/sec in order to meet SLA and app response times. On Azure, you decide to go with the DS3_v2 VM size.  Storage throughput for this VM is 192MB/s. A single 8 TiB E60 disk is used meeting the capacity requirements as well as throughput at 400MiB/sec.

Both selections appear, on the surface, to provide more throughput than 200 MiB/s required:

  •  VM provides 192MiB/s 
  •  E60 provides 400MiB/s 

But when the app gets fired up and loaded with real user workloads the users start screaming because it’s too slow. What went wrong?

Looking deeper there is one critical parameter that needed to be considered. The I/O request size. In this case the I/Os being made by the app are 64 KiB.

In addition to throughput limits there are also separate IOPs limitations set by Azure for the VM and disks. Here is where the relationship between IOPs, request size and throughput come into play:

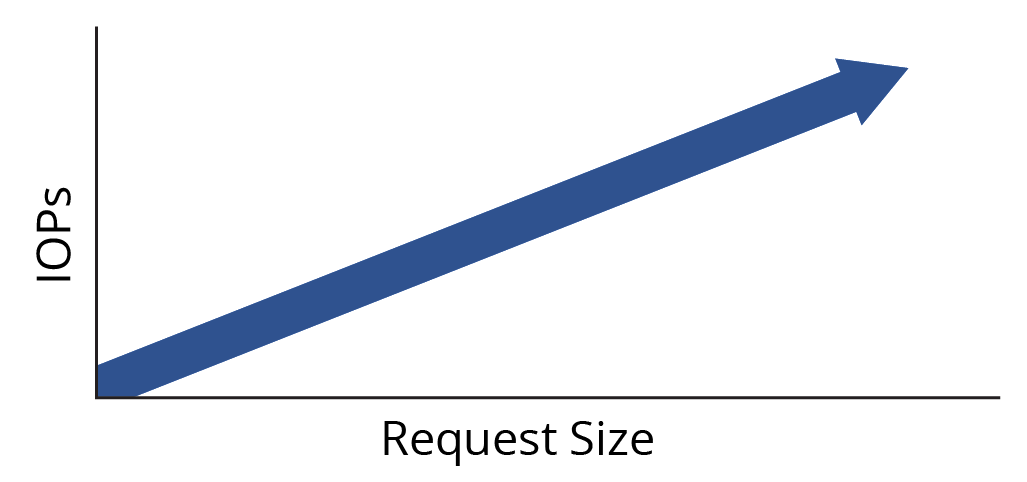
 IOPs X Request Size = Throughput

When we apply the VM storage IOPs limit of 12,800 and the request size of 64K we get:

12,800 IOPs X 64K Request Size = 819200 KiB/s of Throughput 

or 800 MiB/s 


We do not have a bottleneck with the VM limits.

When we apply the disk IOPs limit of 2,000 IOPs per disk and the 64K request size to the formula we get:

2,000 IOPs X 64KiB = 128,000 KiB/s 

or 125 MiB/s 


Clearly this is the throughput bottleneck and is what is limiting the application from reaching its performance target and meeting the SLA requirements.

In order to remove the bottleneck additional disk devices should be combined using RAID to take advantage of the aggregate performance in both IOPs and throughput.

In order to do this, we first need to determine the IOPs we need to achieve using 64K request sizes. 

 IOPs = Throughput / Request Size 

 200 MiB/s = 204,800,320 KiB/s 

204,800 KiB/s / 64KiB = 3,200 IOPs 


In this scenario the geometry of the storage would be better configured using 8 X 1TiB E30 disks, which delivers more throughput at the desired block size. Each disk provides 60 MiB/s throughput for a combined 480 MiB/s (8 X 60MiB/s)

Each disk provides 500 IOPs for an aggregate of 4,000 IOPs (8 X 500). At a combined cap of 4,000 iops and a request size of 64KiB this would achieve 250MiB/s.

64KiB X 4,000 = 256000 KiB/s 

or 250 MiB/s 


This configuration effectively removes the bottleneck. The performance needs, throughput AND IOPs, of the app are now all satisfied with additional headroom for future growth, variations in cloud behavior, etc.

Conclusions

It’s not enough to simply look at disk and VM throughput limits to deliver the expected performance to meet SLA’s. One must consider the actual application workload I/O request sizes combined with available IOPs to understand the real throughput picture as seen in the chart below.

Available IOPs LimitRequest sizeMax Throughput 
20004 KiB8000 KiB/s (7.8 MiB/s) 
200032 KiB64,000 KiB/s  (62.5 MiB/s) 
200064 KiB128,000 KiB/s (125 MiB/s) 
2000128 KiB256,000 KiB/s (250 MiB/s) 

Use the simple formulas and process above and it will get your storage performance into the ballpark with less experimentation, wasted time and deliver the results you seek.